
Monthly Seasonality
Betting On Past Monthly Winners

My recent caution about the market getting overheated turned out to be timely—tariff curveballs have spooked investors, causing stocks to stumble significantly. Rather than obsessing over fluctuating prices and making impulsive trades I'll later regret, I've decided to channel my nervous energy into something more productive. So here’s what I cooked up this week.
Monthly Winners: Can History Repeat?
I've occasionally toyed with seasonality strategies in my QuantMage portfolios but never truly dived deep, except a dabble in the Halloween Effect. This week, curiosity took hold. I decided to investigate which asset, country, or sector ETF historically performs best each month. After spending about half an hour exploring, here's the intriguing result:
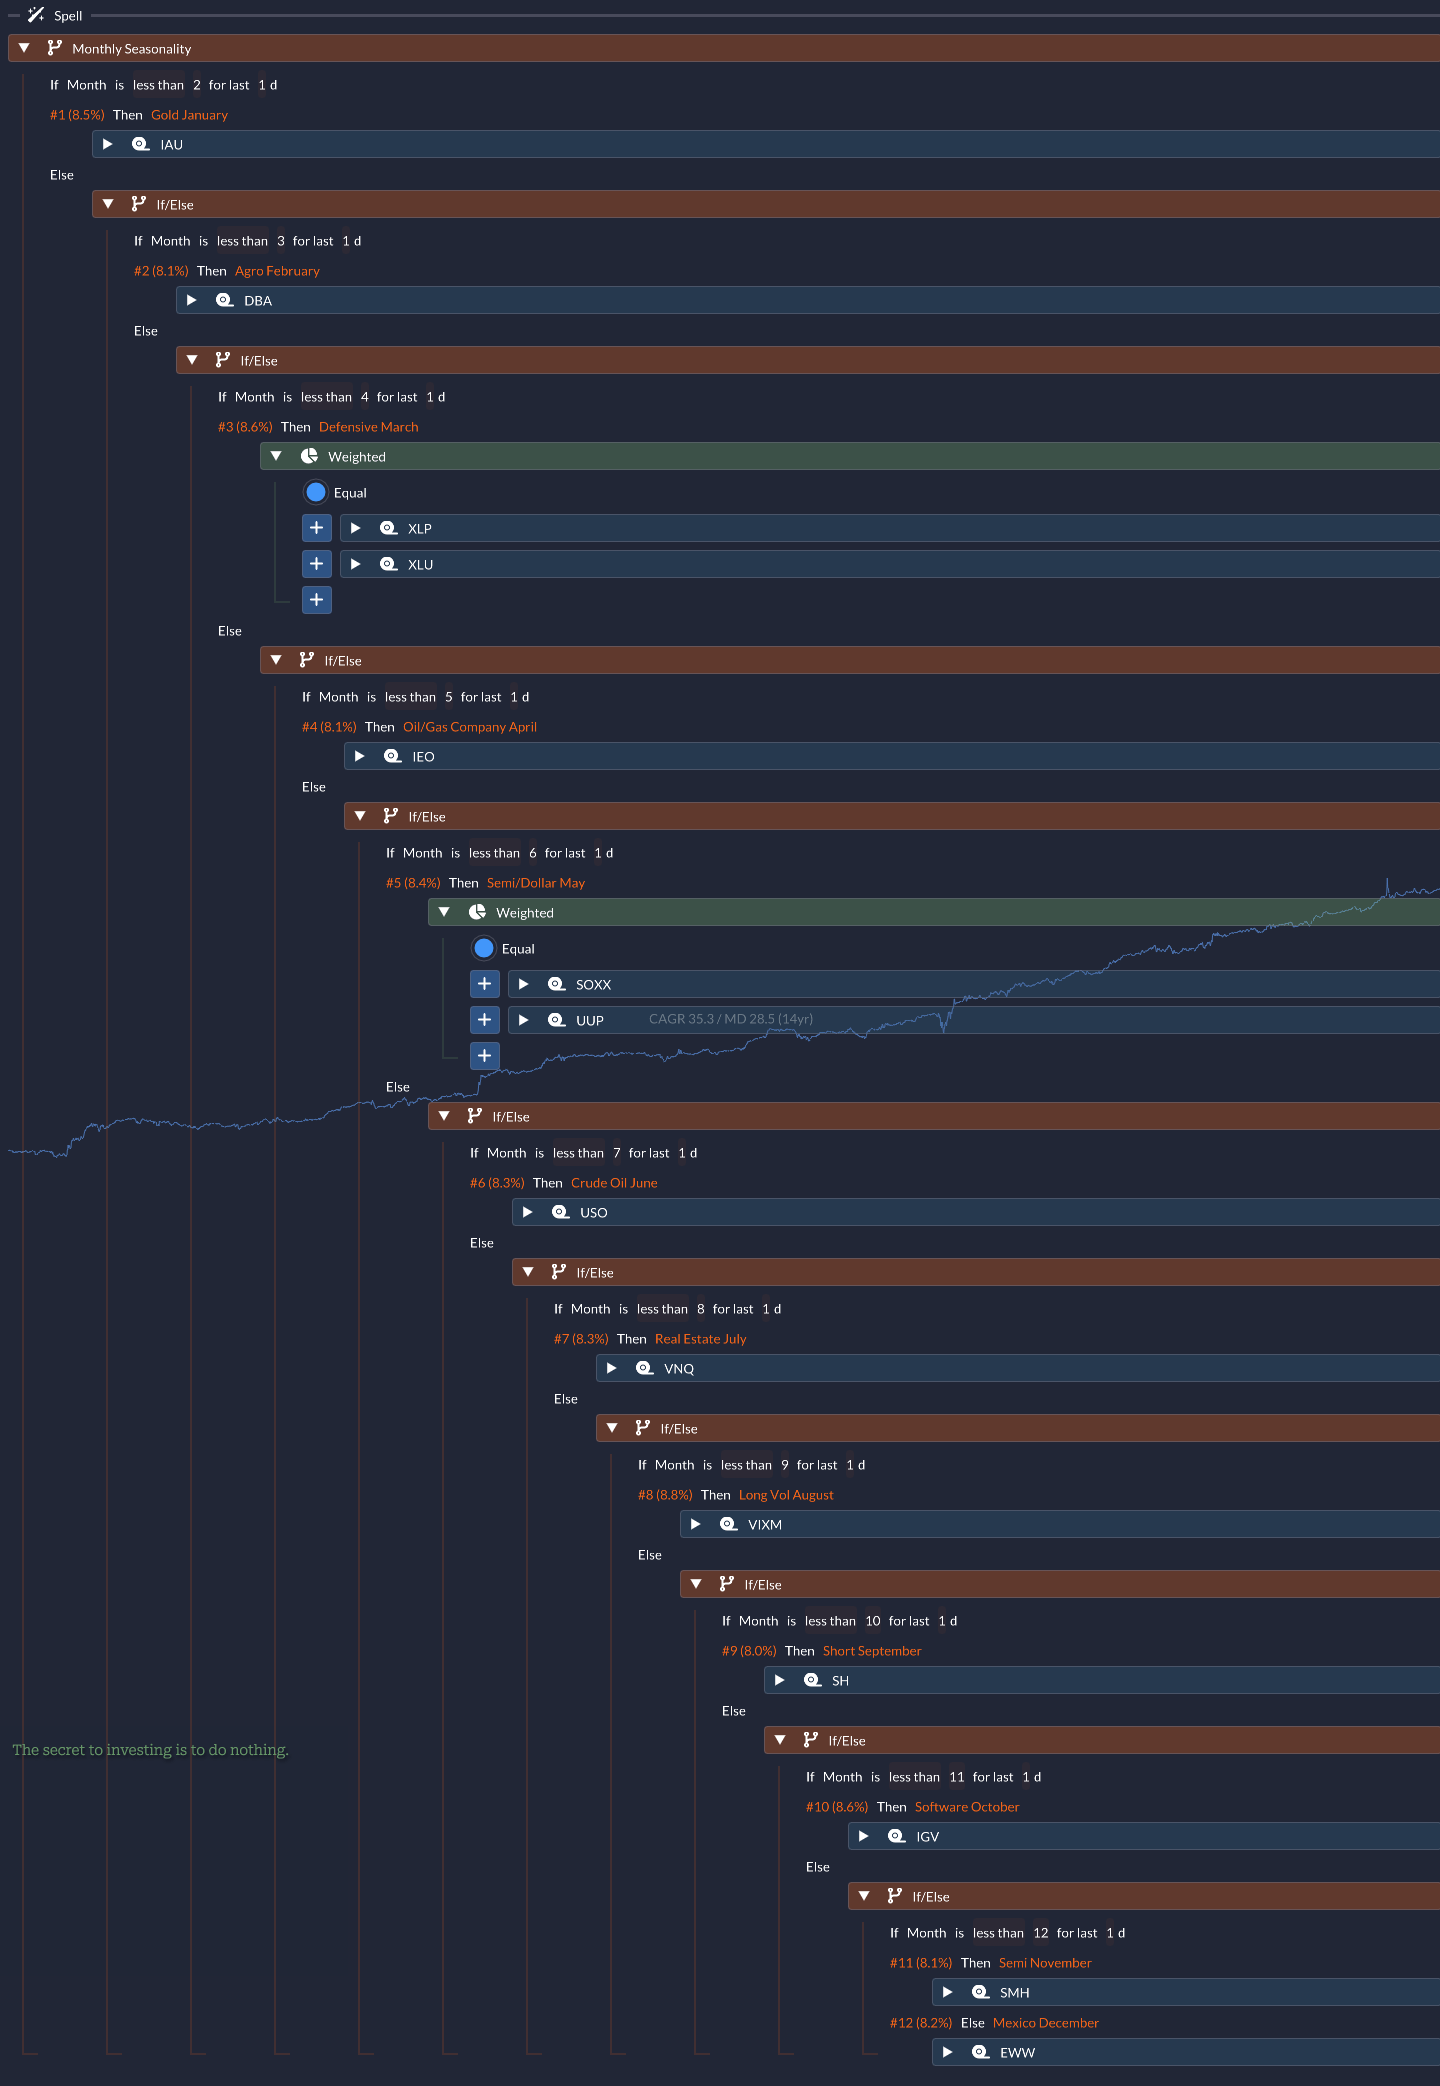
Each month highlights a clear "winner" ETF (or two winners in the case of March and May). You can follow along with my orange notes, which briefly explain each month's theme.
And here's how it stacks up overall:
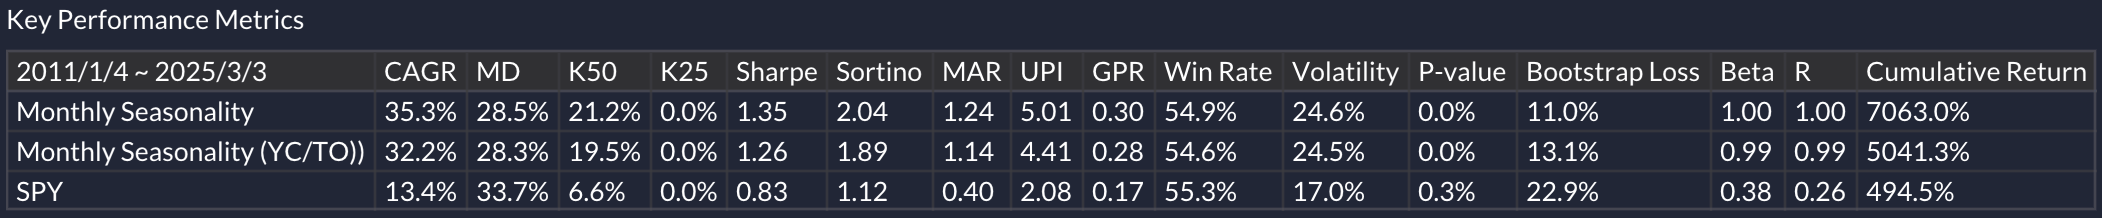
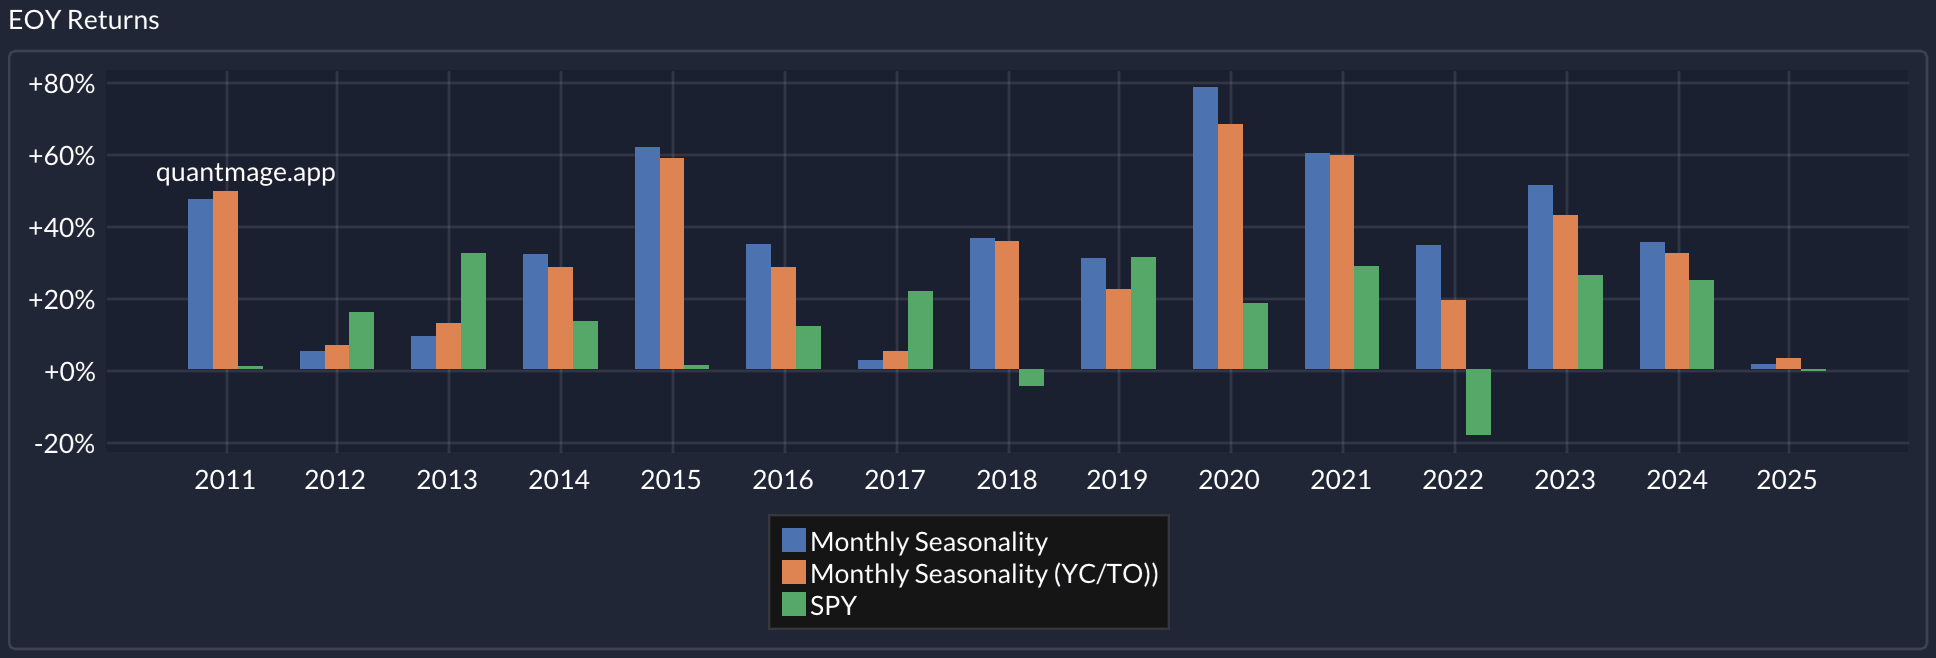
We're talking an impressive compound annual growth rate (CAGR) of 35.3% over 14 years—without leverage—plus a manageable max drawdown of 28.5% and volatility of 24.6%. That's genuinely notable, especially since there hasn’t been a single negative year:
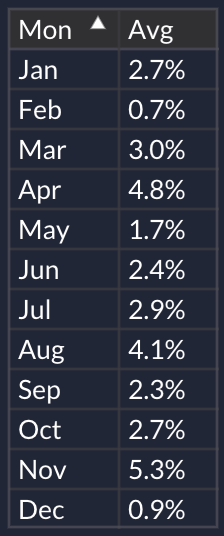
And, not surprisingly, average monthly returns are consistently positive:
You can play around with the spell yourself here.
📣 Disclaimer: Remember, this is purely informational—not financial advice. Always conduct your own research and talk to a financial professional before diving in.
Past Performance ≠ Future Results
Before rushing in with your hard-earned money, let’s inject a bit of realism: past performance doesn’t guarantee future results. Sure, some ETFs have compelling narratives supporting their seasonal strengths, but for others, it’s purely mysterious. Luck might be playing a bigger role than we'd like to admit.
Look at this heat map to see what I mean:
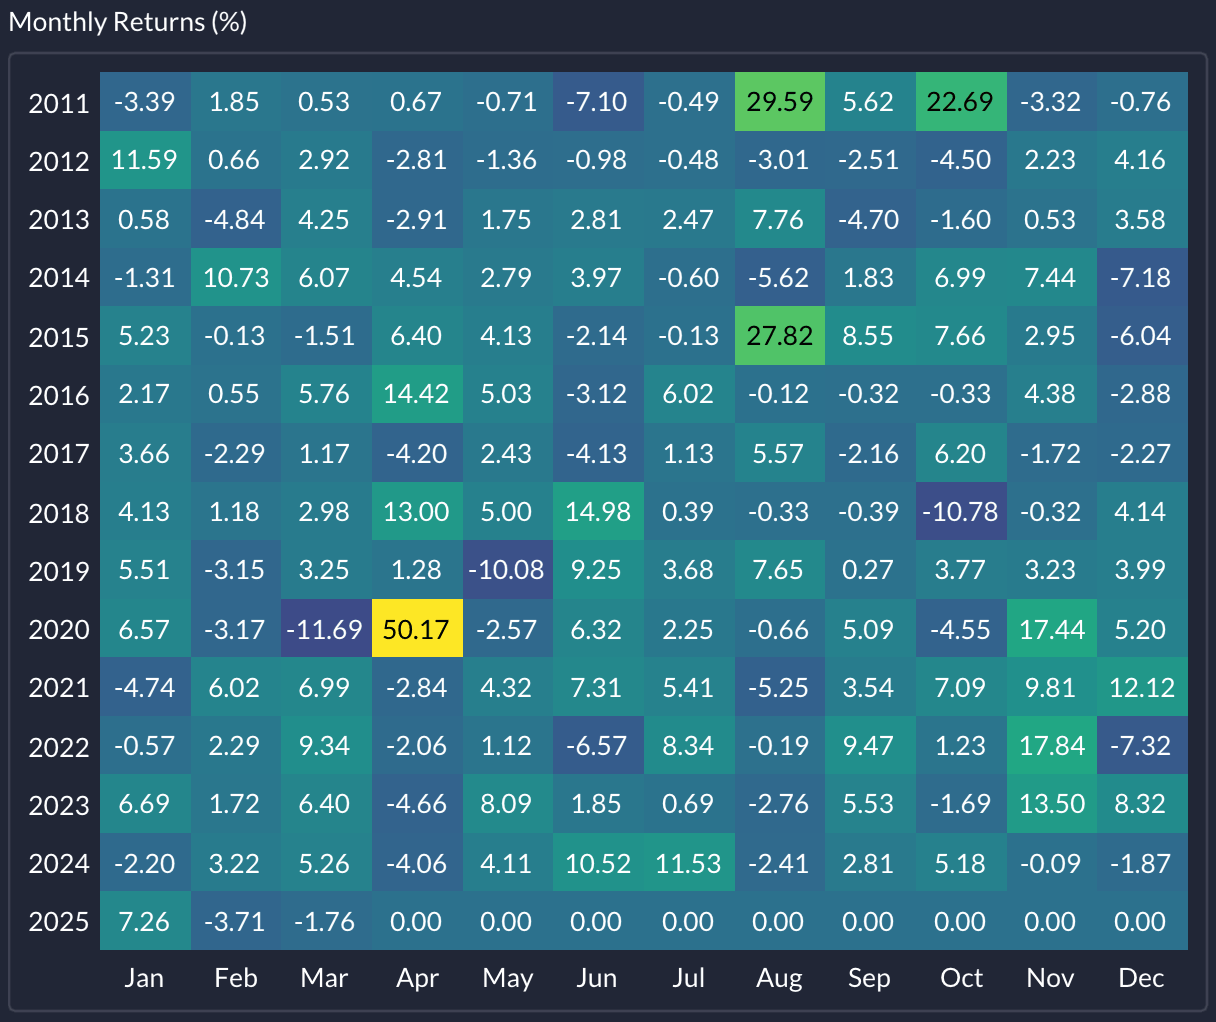
Take the Oil/Gas Company April, for instance. Its standout 2020 return of 50.17% came in the bizarre aftermath of oil futures diving into negative territory—a literal once-in-history anomaly. The Long Vol August had similar outlier spikes in 2011 and 2015. Can these dramatic outliers reliably repeat?
Also, keep in mind our dataset isn't enormous—just a couple dozen observations per ETF. Statistical confidence isn’t rock-solid here.
So, what’s your take? Does this monthly seasonality strategy have real merit, or is it mostly luck waiting to disappoint? Let me know your thoughts in the comments! 💬👇
Intriguing! Thank you.
In general, I don't like seasonality. To me, it sounds like investing based on mostly coincidental data, akin to buying when skirts are short, or staying invested after a positive January. That said, Ryan Detrick's regular glance at seasonality had a better track record for the past three years than most investors.
As to your algorithm, perhaps you'd consider trying out a quarterly approach? The pick-of-the-month approach feels a bit over-optimised to me.
As of 2025.04.16, MDD is over -35%!
But it has never actually been over -30%! The program seems weird.
Am I not understanding it?