
Monthly Seasonality and the Halloween Effect
Buy in November, Sell in May—or Sell in August?

The Halloween Effect, also known as the Halloween Indicator, is a well-known stock market adage suggesting that stocks perform better from November through April than they do from May through October.

This concept seems to hold some weight when you look at SPY’s monthly returns over a 31-year period:
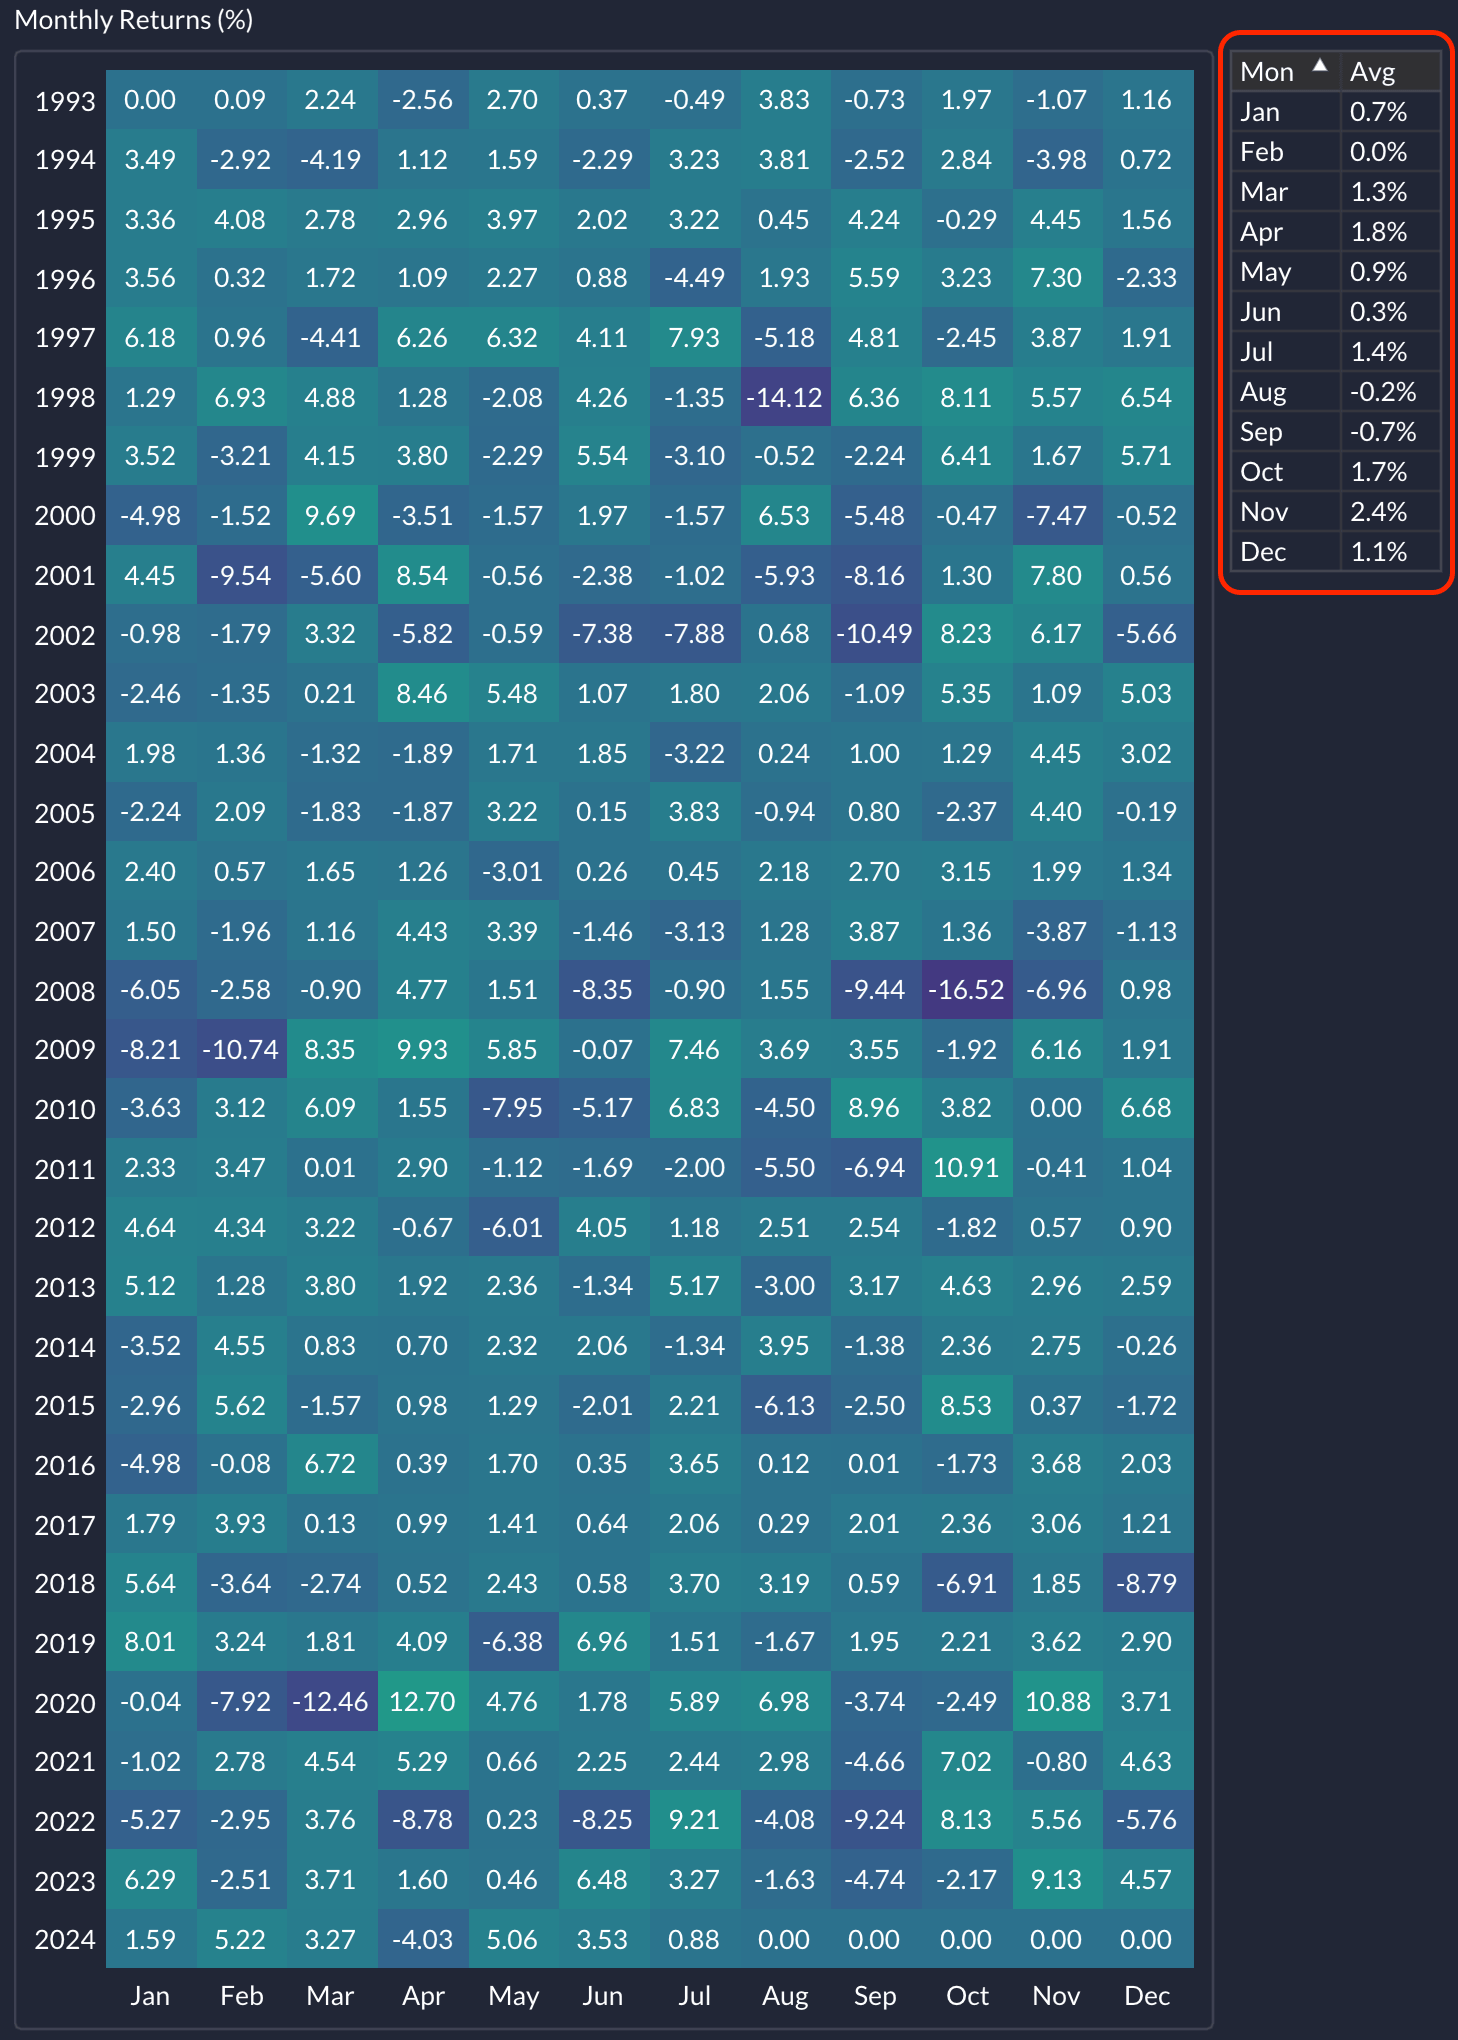
The May-to-October period indeed appears to have weaker returns, although July and October show decent averages. Keep in mind, though, that an arithmetic mean can be misleading since it ignores the impact of compounding. I recently stumbled upon an article suggesting it might be more accurate to “Sell in August” since 2012. Let’s see if this holds true using QuantMage. First, here’s how the original Halloween Strategy performs:
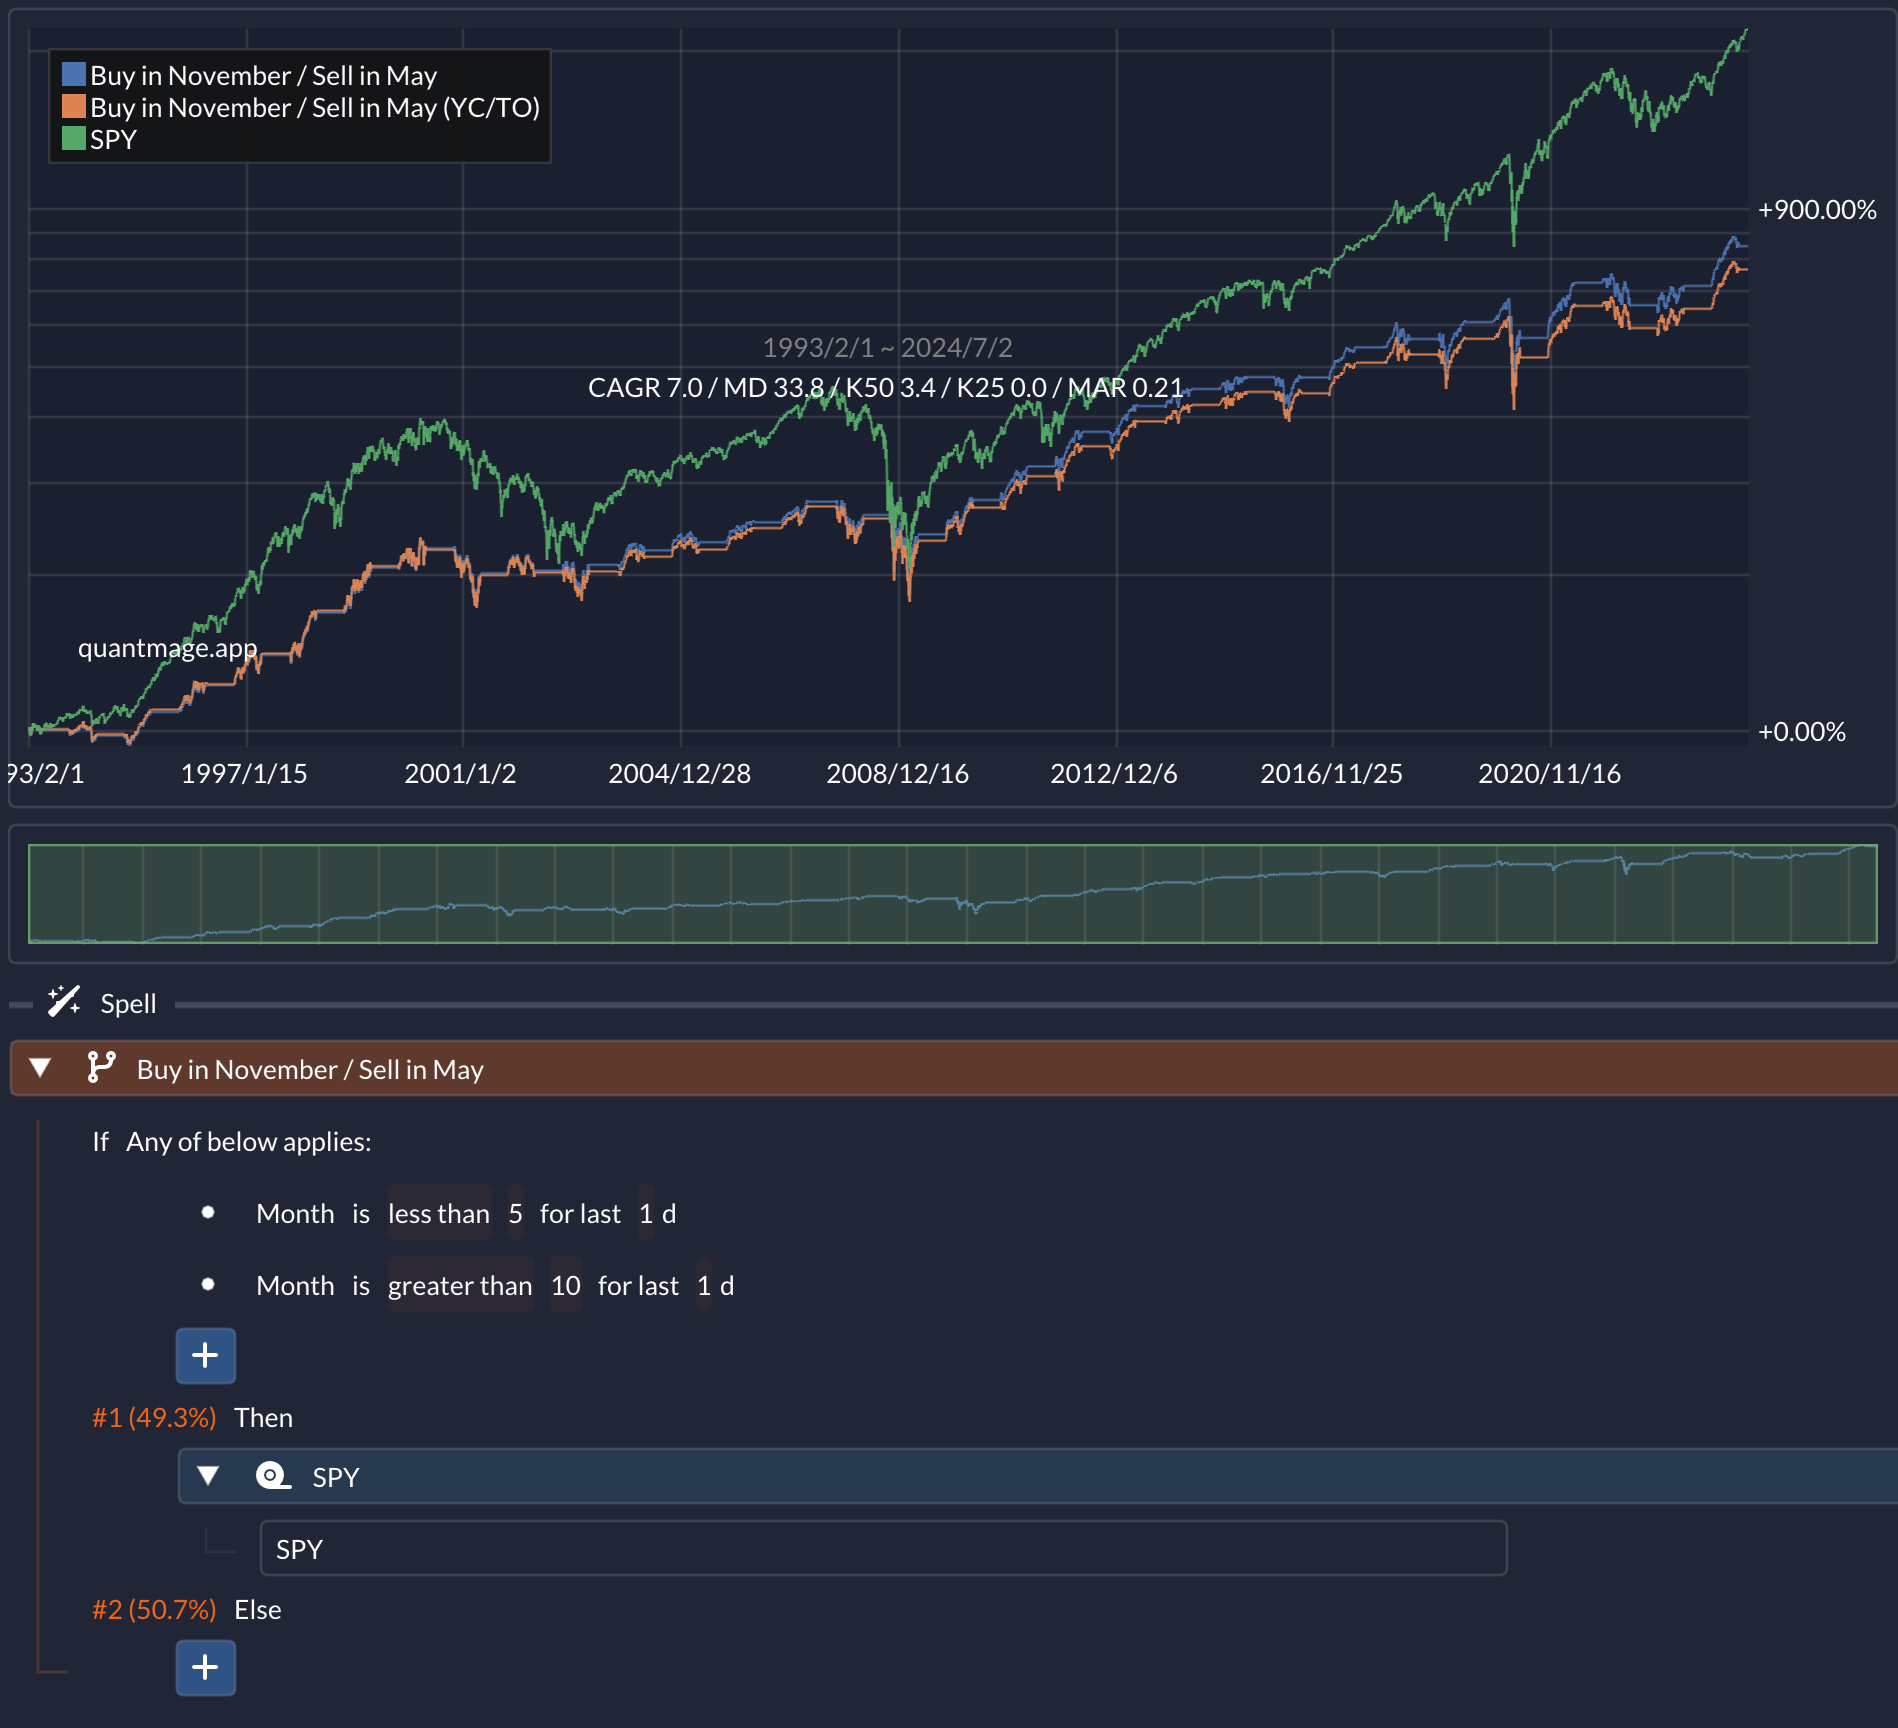
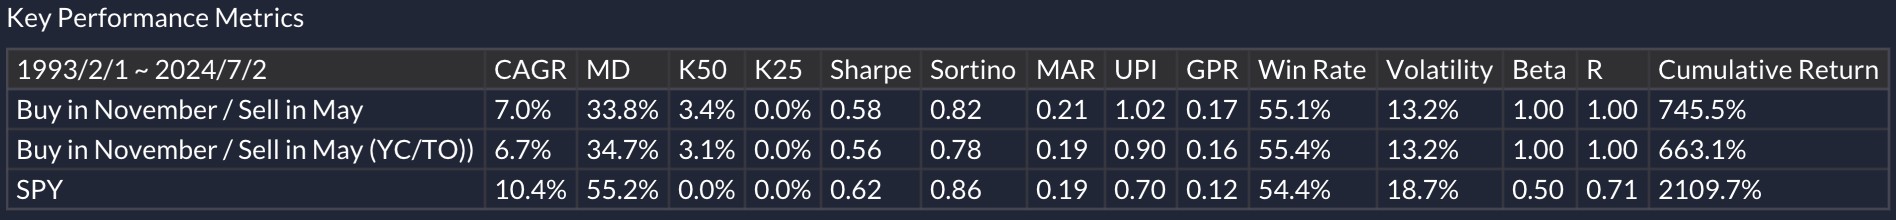
Compare this strategy with the SPY buy-and-hold over the same period, which shows a 10.4% CAGR and a 55.2% maximum drawdown. Here’s how the “Sell in August” version performs over the same timeframe:
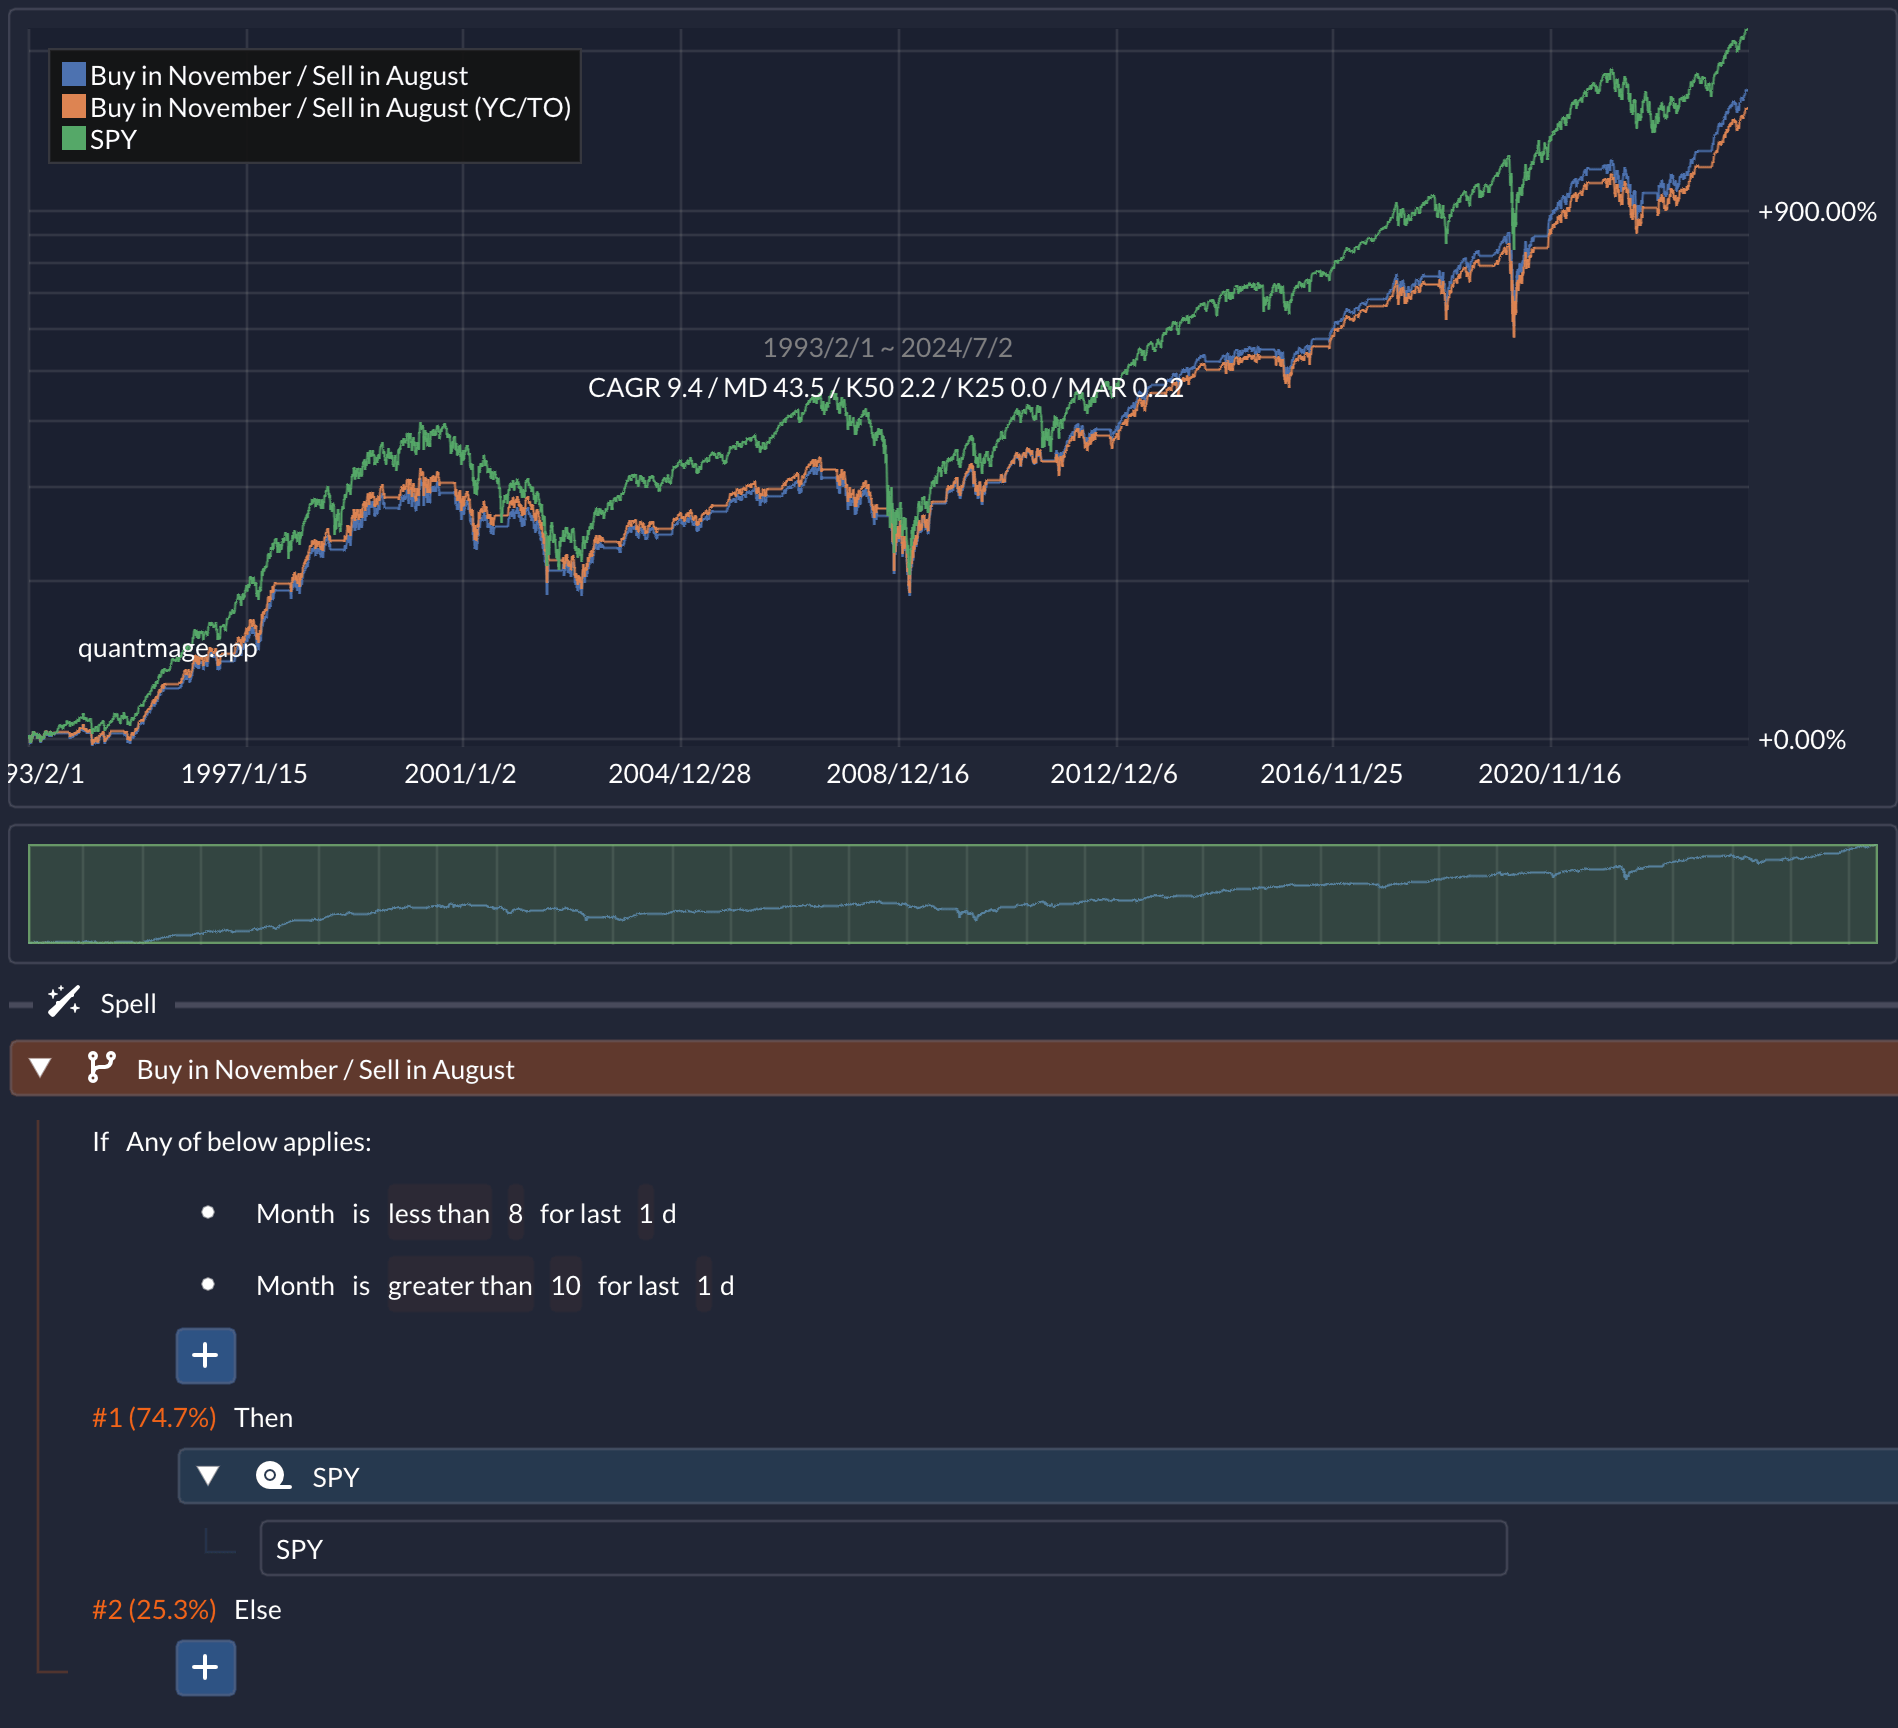
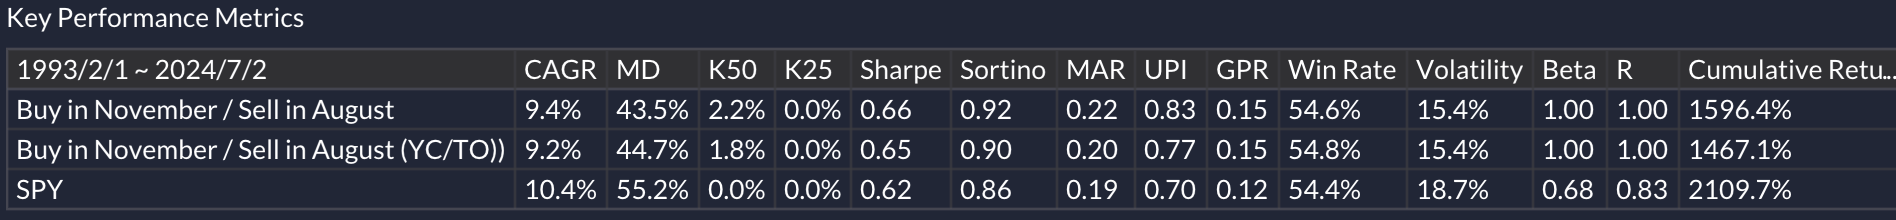
This version meaningfully raises the CAGR but also increases the maximum drawdown. Risk-adjusted returns (as measured by the Sharpe ratio and other metrics) are also better. Since October’s average return was positive, what about trying a “Buy in October” strategy instead?
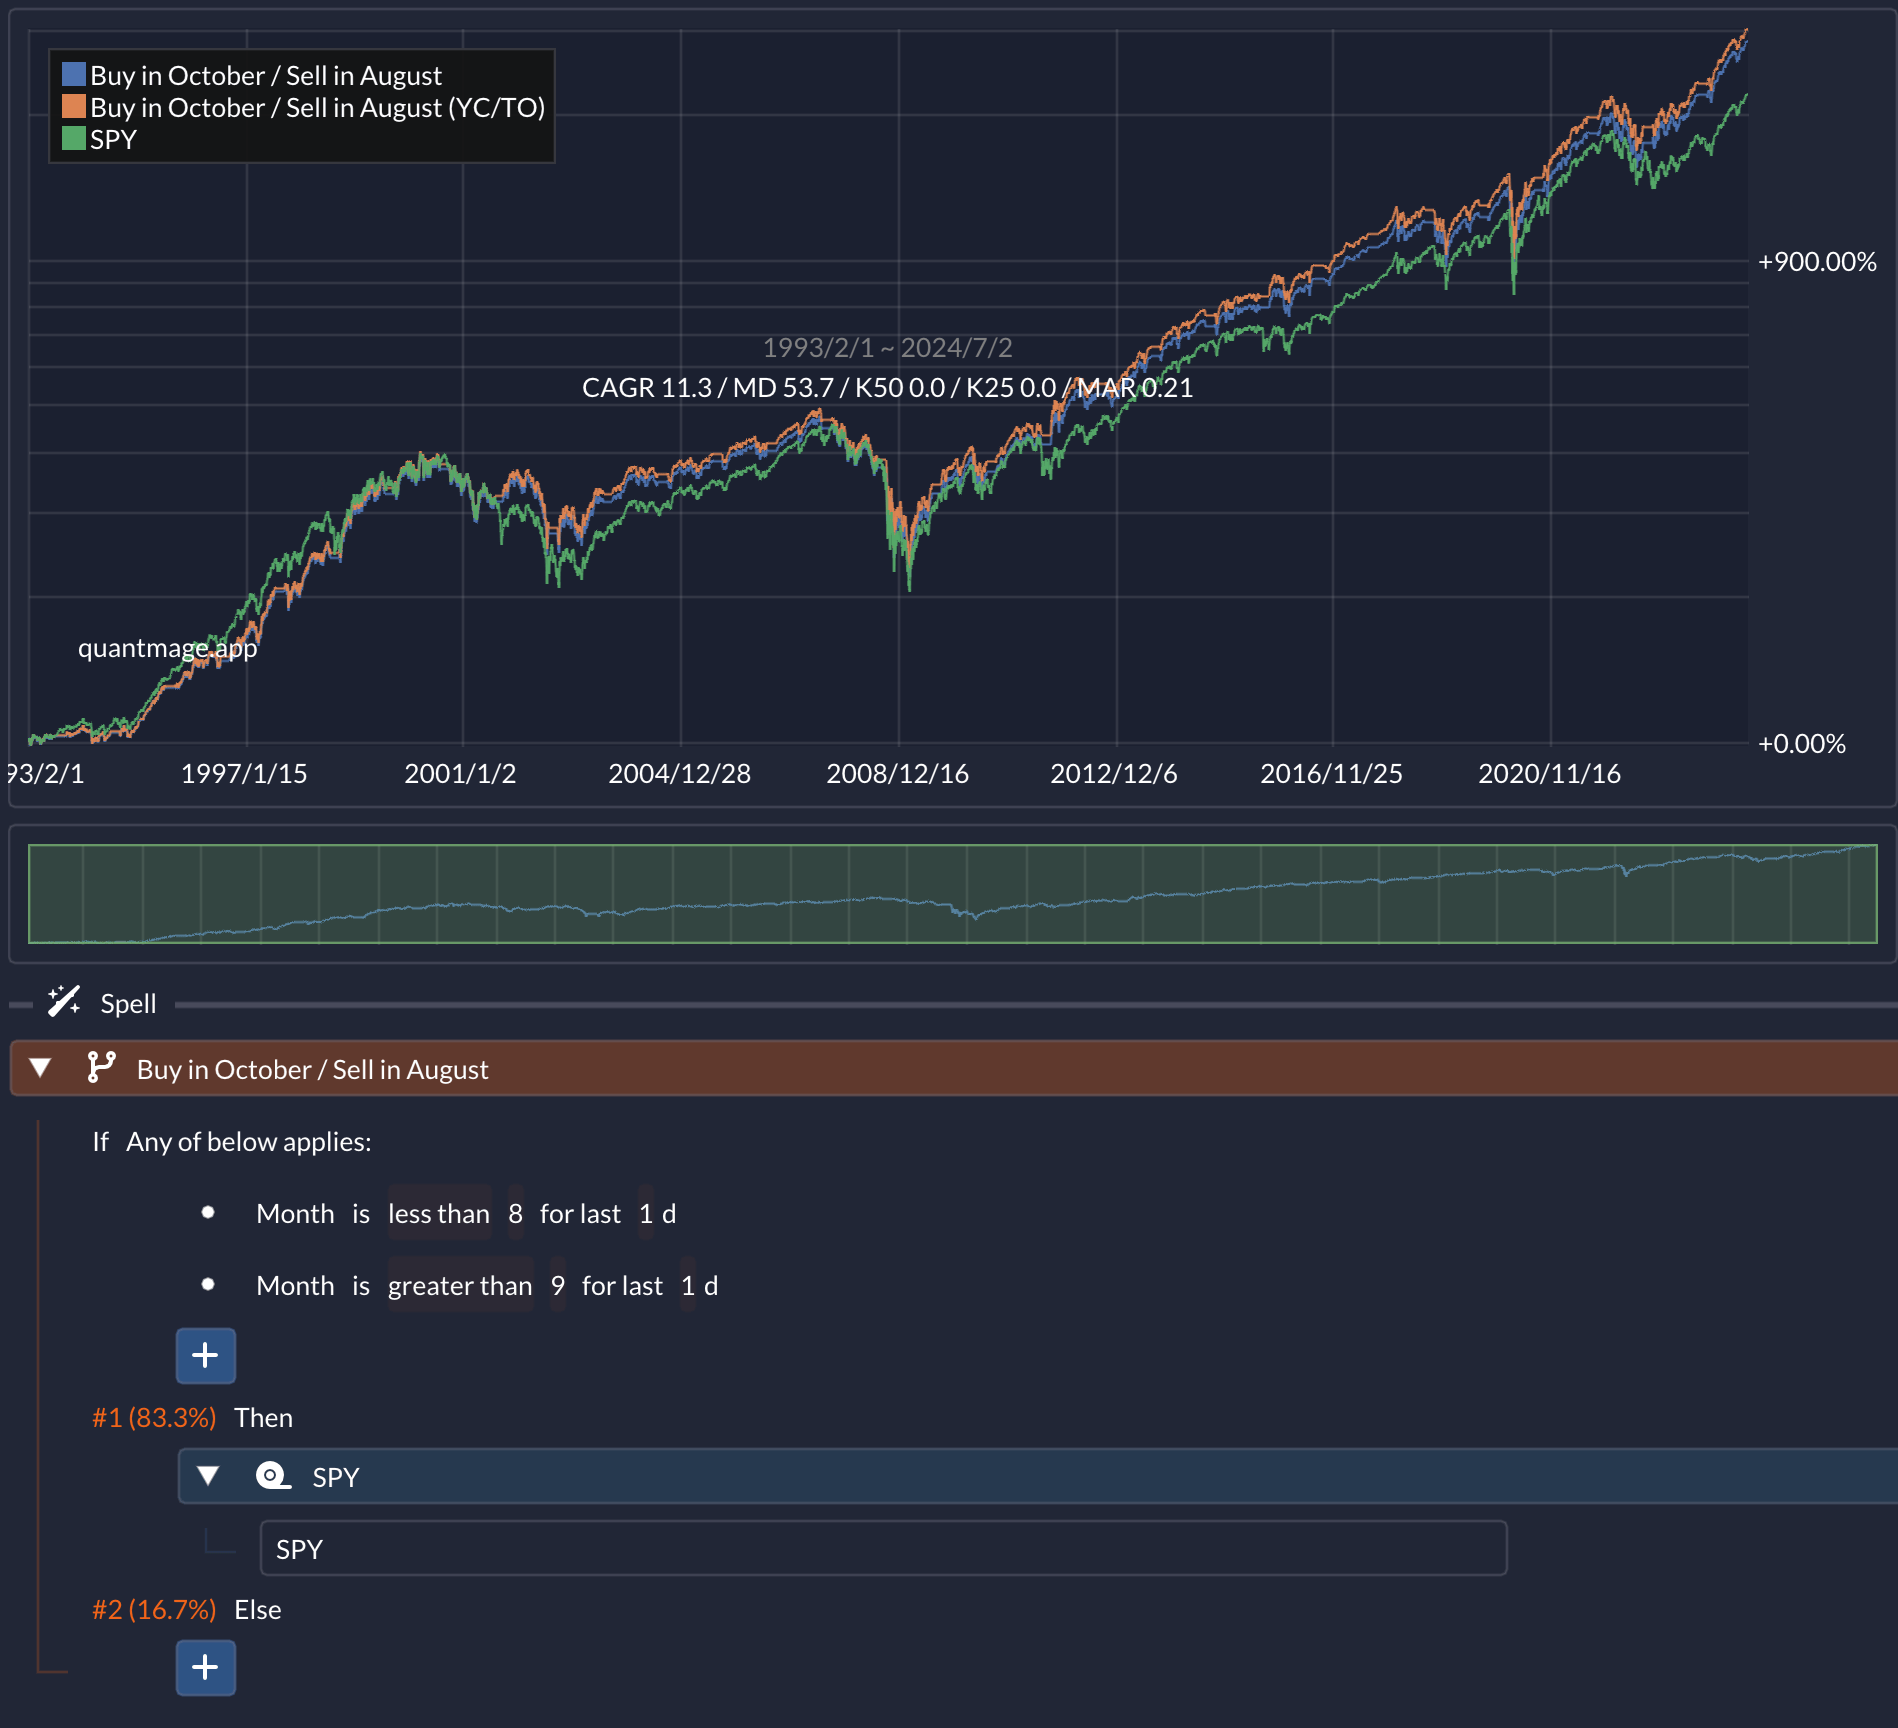
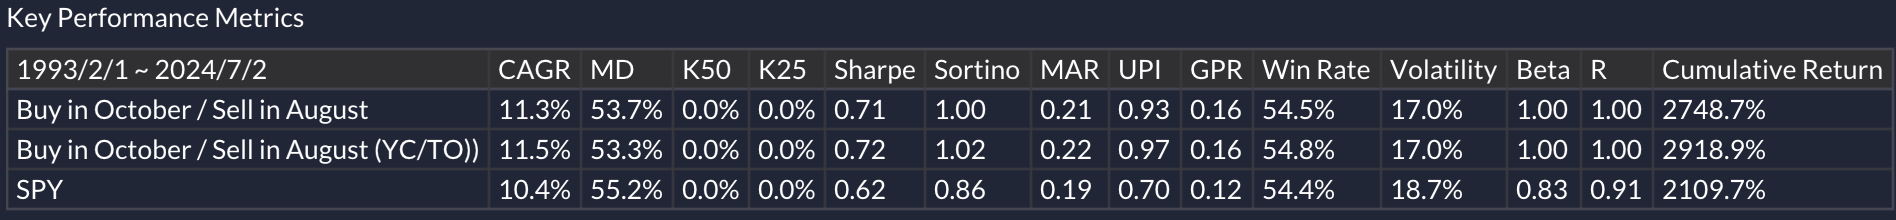
A similar positive trend is observed. The article points out that the “Sell in August” phenomenon has been especially noticeable since 2012. Here are the performance charts for each strategy since 2012:
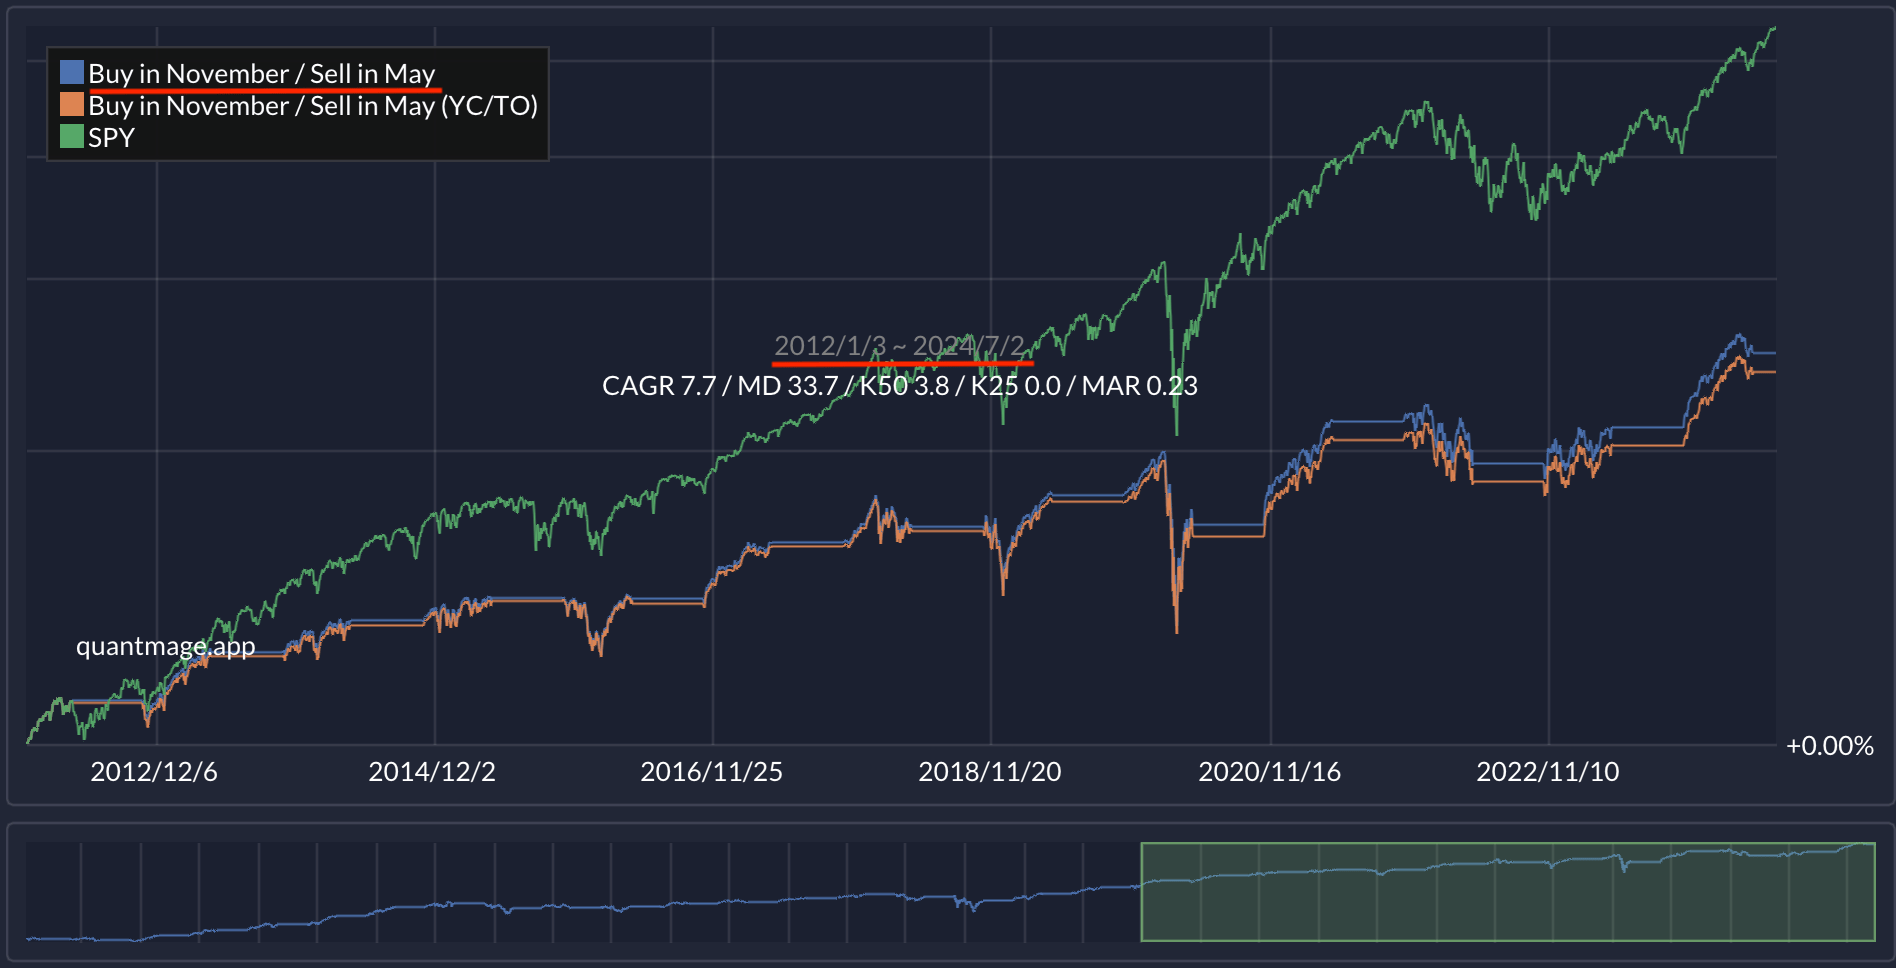
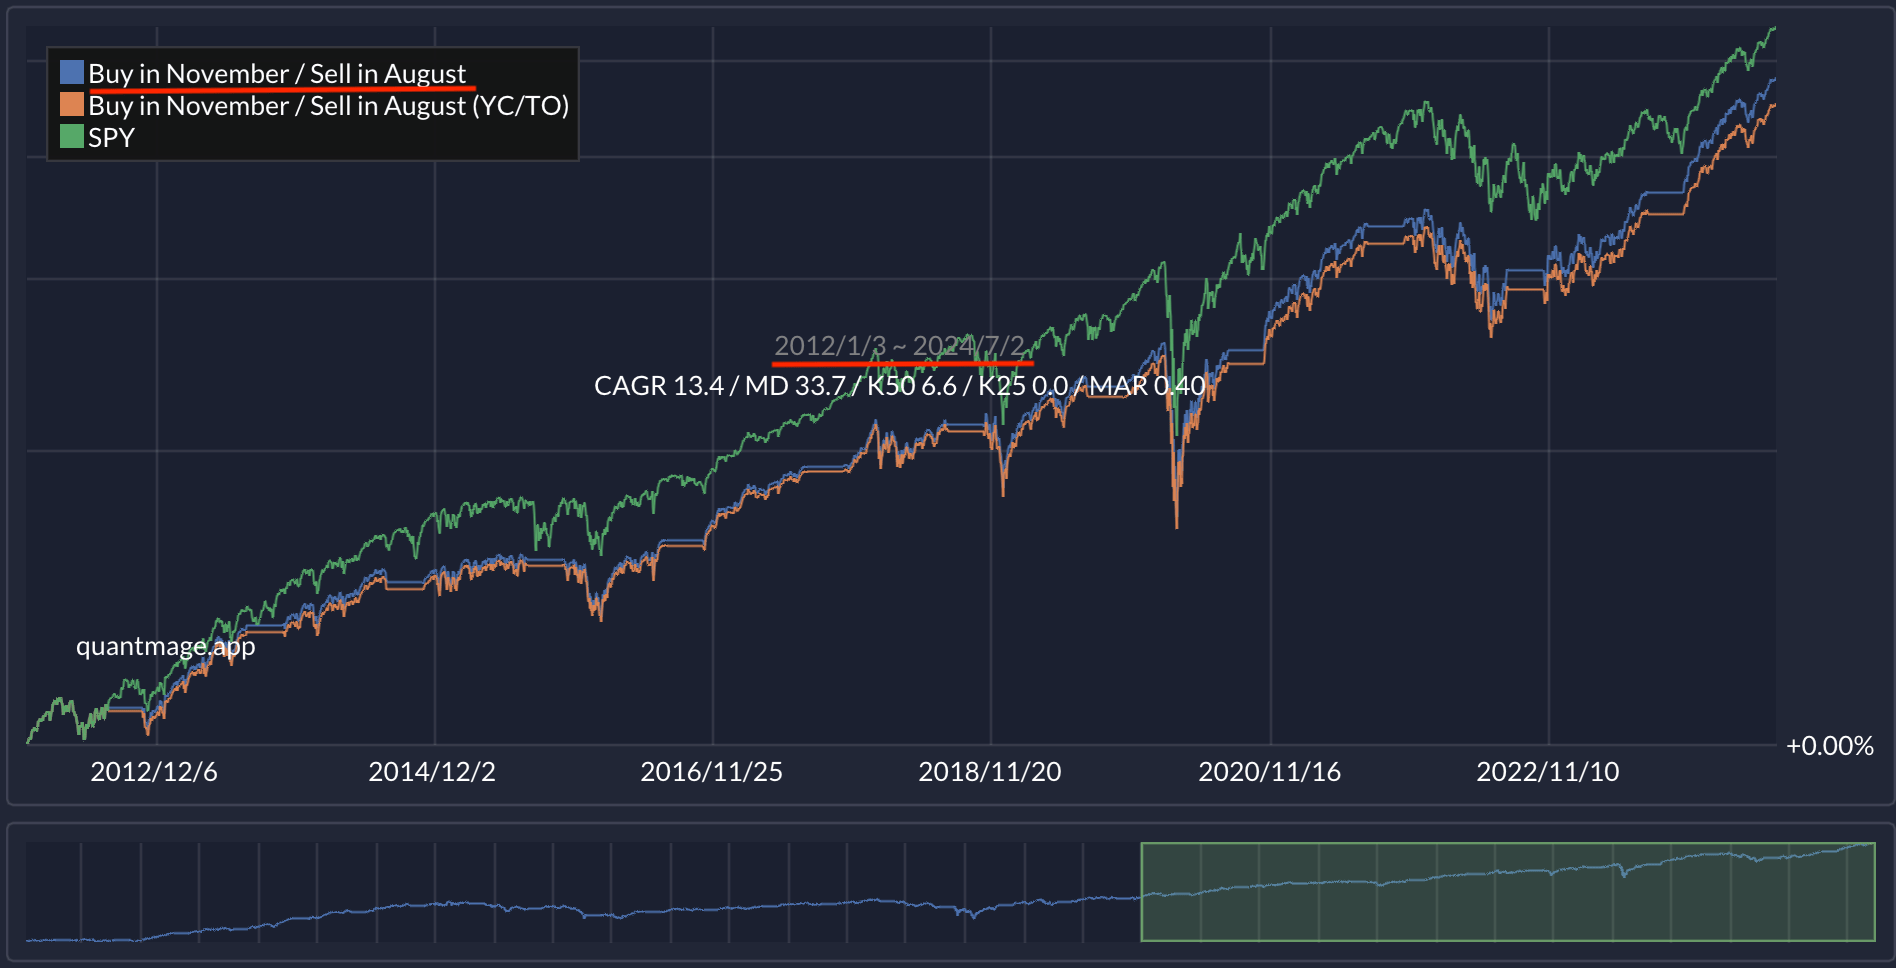
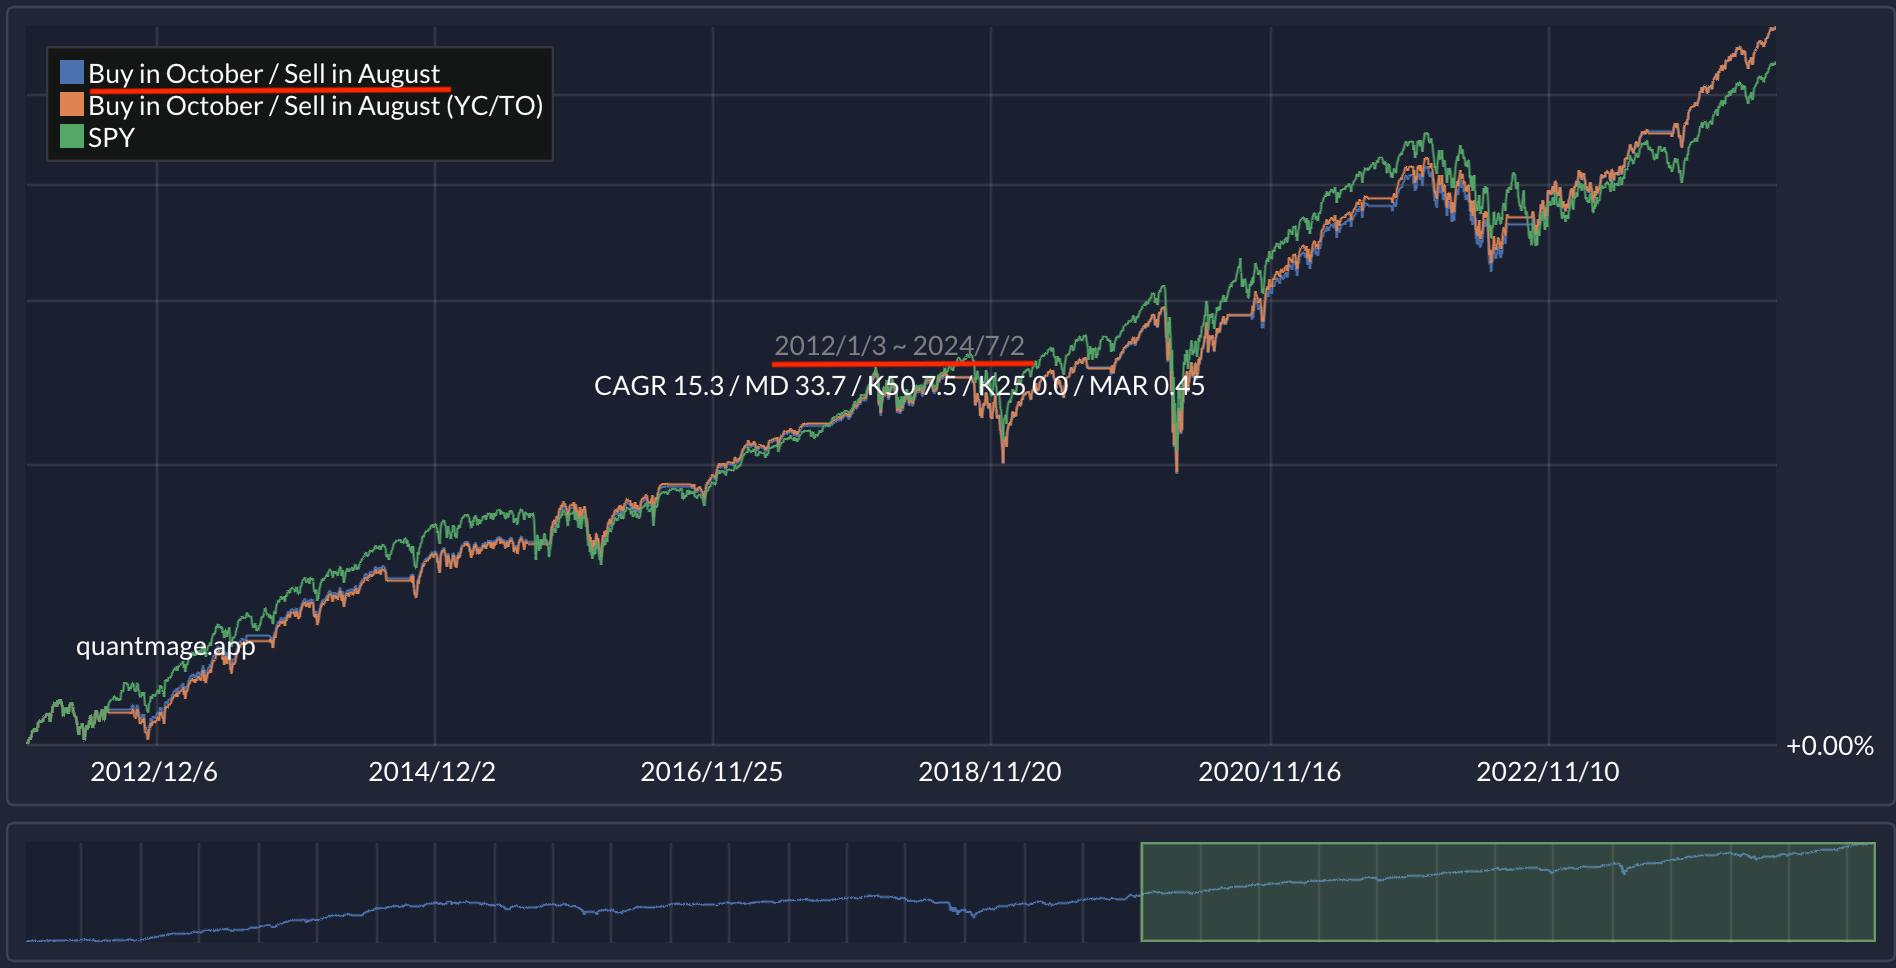
The “Sell in August” versions indeed perform better, confirming the article’s claim. However, this new phenomenon might just be a byproduct of the bull market in the 2010s. Note that there are some differences in QuantMage’s trade executions: it trades at the beginning of the month, while the article trades at the end of the previous month.
So, does this kind of monthly seasonality have any legs, or is it just an example of apophenia—the human tendency to see patterns in random information? As rationalizing (not necessarily rational) creatures, people are quick to provide plausible explanations. Whether this pattern will continue, change (like shifting from “Sell in May” to “Sell in August”), or disappear altogether is anyone’s guess. Personally, I’m using it in some of my strategies as a tactical measure to reduce the probability of loss.
As always, remember that the content here is purely informational. It’s not investment advice or a recommendation to buy or sell any stocks. Always do your own research and consider talking to a financial professional before making any investment moves.
Just as a side note, I recently did a little test to see if I could generate estimates for sectors that are seasonally (monthly) stronger based on the past few (1, 2, 5, 10) years of observations. I used Ken French's dataset of daily sector returns to mimic the SPDR sectors since 1928. I found that most months there wasn't much consistency in sector outperformance, maybe just months 1, 3, 6, and 10. February had anti performance (previous winners did worse). Even in the best months, it seemed like a lot of work for not much gain, and the seasonality effect seems to have decreased over time.