
Canary Signal Series: High Beta vs. Low Vol
How the SPHB/SPLV Ratio Might Just Be Your New Favorite Market Thermometer


Lately I stumbled across a post (somewhere in the internet rabbit hole—credit to the mystery author!) that compared two ETFs I only half‑remembered: SPHB, which holds the 100 highest‑beta names in the S&P 500, and SPLV, which holds the 100 lowest‑volatility names. The idea felt obvious in hindsight: when the raciest stocks are outrunning the sleepiest ones, the market is probably feeling frisky. Why not track the price ratio of the two as a canary?
📣 Usual disclaimer: None of this is financial advice. Kick the tires yourself and talk to a pro before committing real money.
The Basic Momentum Play
I dropped the ratio into QuantMage, slapped a simple 12‑month SMA‑momentum rule on it, and—voilà:

Not too shabby! We’re looking at a 9.9% annual return with just an 11% max drawdown over 13 years – and the strategy was only in the market 54.5% of the time. Getting a Sharpe Ratio above 1.0 with a single binary signal? That’s like finding a $20 bill in your old jacket pocket.
The logic here is beautifully simple: when the wild children (high beta) are outperforming the steady eddies (low vol), it’s party time in the market.
Making It More Reliable
Adding a simple twist—requiring the momentum signal to persist for two consecutive days—significantly smoothed the ride:
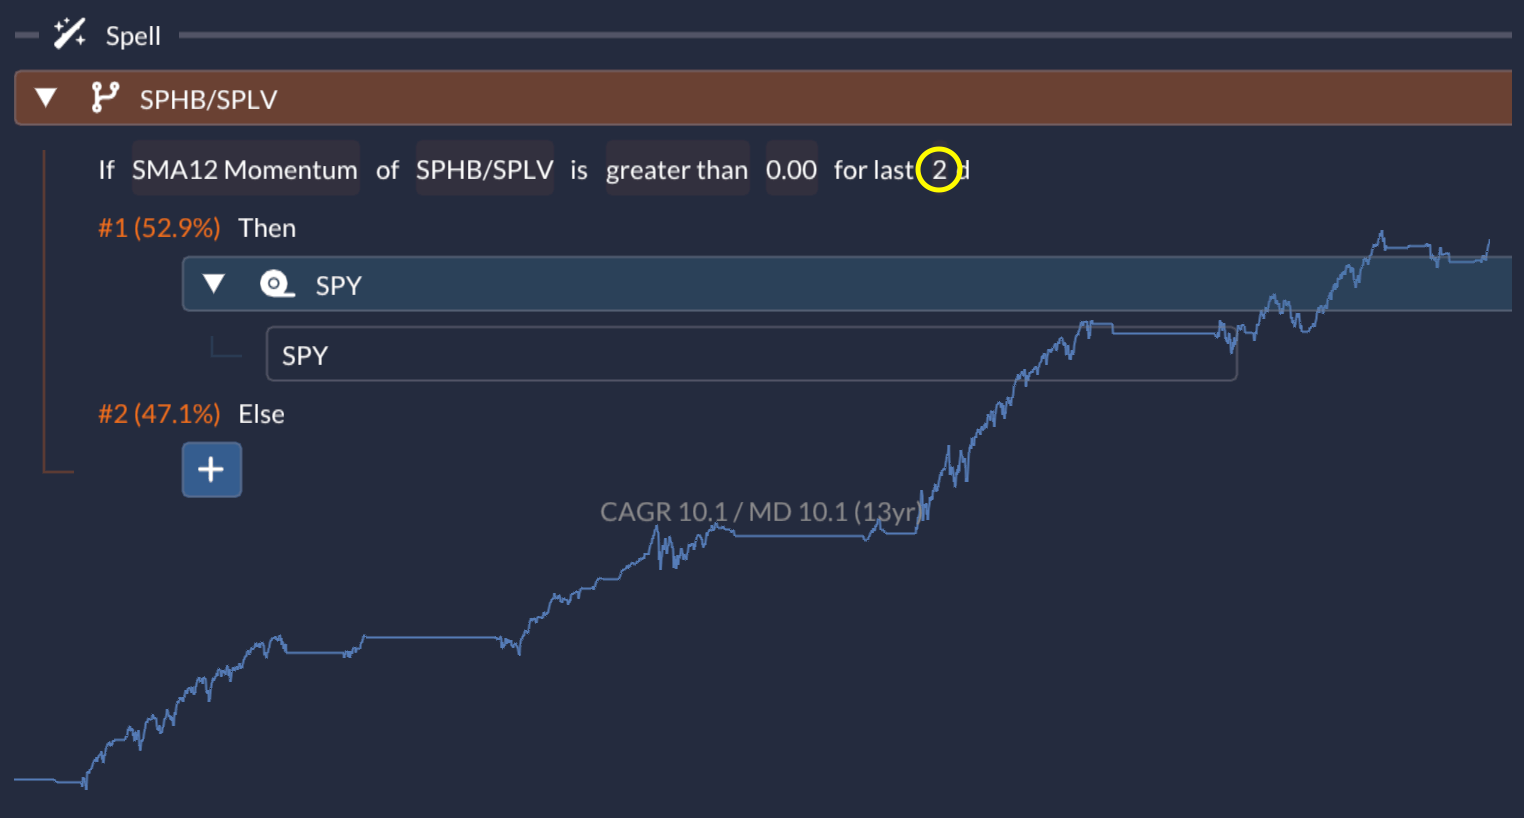
Better risk-adjusted return, fewer whipsaws. Sometimes, patience pays.
Time Travel with Correlated Tickers
Unfortunately, SPHB and SPLV don’t go far enough back to cover the 2008 GFC. So I used QuantMage’s Correlated Tickers tool to find proxies:


With these substitutes, I could stretch the backtest to 17 years:

The results weren’t quite as sparkly, but still solid enough to keep me interested. More importantly, it gave me confidence that this wasn’t just a post-2010 phenomenon.
Building a Risk‑Off Sleeve: Gold
Routing capital to IAU (gold) when the signal is risk‑off nudged returns higher—at the cost of a bit more bumpiness:

Turning Up the Heat
Want to live dangerously? Replace SPY with QQQ (the tech-heavy Nasdaq ETF):

Still not spicy enough? Try QLD, which is basically QQQ on steroids (2x levered):

Now we’re cooking with gas – 33.1% annual returns with a 24.5% max drawdown over 13 years. Of course, betting on continued tech dominance might be a bit like assuming your favorite sports team will keep winning forever. But hey, it’s been working so far!
The Power Combo
Pair the canary with my recently shared RSI Ensemble (a mean‑reversion filter) and the curve really takes off:

CAGR 59.5 % against 22.2 % drawdown—proof that uncorrelated edges can be rocket fuel.
Bottom Line
Core thesis: When high‑beta leads low‑vol, the crowd is reaching for risk. The ratio is a neat single‑line risk‑on/off toggle.
Durability: Will it keep its edge? Only the future knows. Longer, out‑of‑sample regimes (think 2000–02 or 1970s style stagflation) would be instructive.
Overfit watch: The fancier combos (QQQ, QLD, RSI mash‑ups) pack extra assumptions. Treat them as hypotheses, not gospel.
Your turn: What uncorrelated filters or asset sleeves would you bolt on—commodities, managed futures, something weird? How would you tame that drawdown without killing the juice?
Super satisfying strategy!
The logic is so simple and legible and pure. Thanks for sharing.
Here's my quick spin on it. The only new logic of note is that I added a short-term corporate bond (SPSB) SMA trend as a risk-off signal. I'm using BTAL as my risk-off asset (going short high-beta and long low-beta fits the theme of the strategy nicely).
https://quantmage.app/grimoire/a39719a0a458f3109f17666196786896
Great Idea!! Thank you very much. :)