Price Ratio Momentums
Applying Momentum Indicators to Price Ratios for Fun & Profit
At QuantMage, we’re always exploring new ways to turn market data into actionable insights. Recently, we added support for price ratios in our suite of indicators—and early experiments have been exciting. It turns out that momentum indicators like 13612W, 13612U, and SMA12 work pretty well when applied to price ratios. Today, I want to walk you through a few promising signals I’ve discovered.
📣 Disclaimer: This content is for informational purposes only. Do your own research and consult a financial professional before making any investment decisions.
Internet vs. Utility
Our first experiment compares the internet industry, represented by FDN, against the utility sector, represented by XLU, using the slower-moving SMA12 momentum indicator. The idea? Go risk-on when the internet sector shows positive relative momentum against utilities. Over 17 years, this strategy has delivered a respectable 11.7% CAGR with a 15.9% maximum drawdown.
Stock vs. Dollar
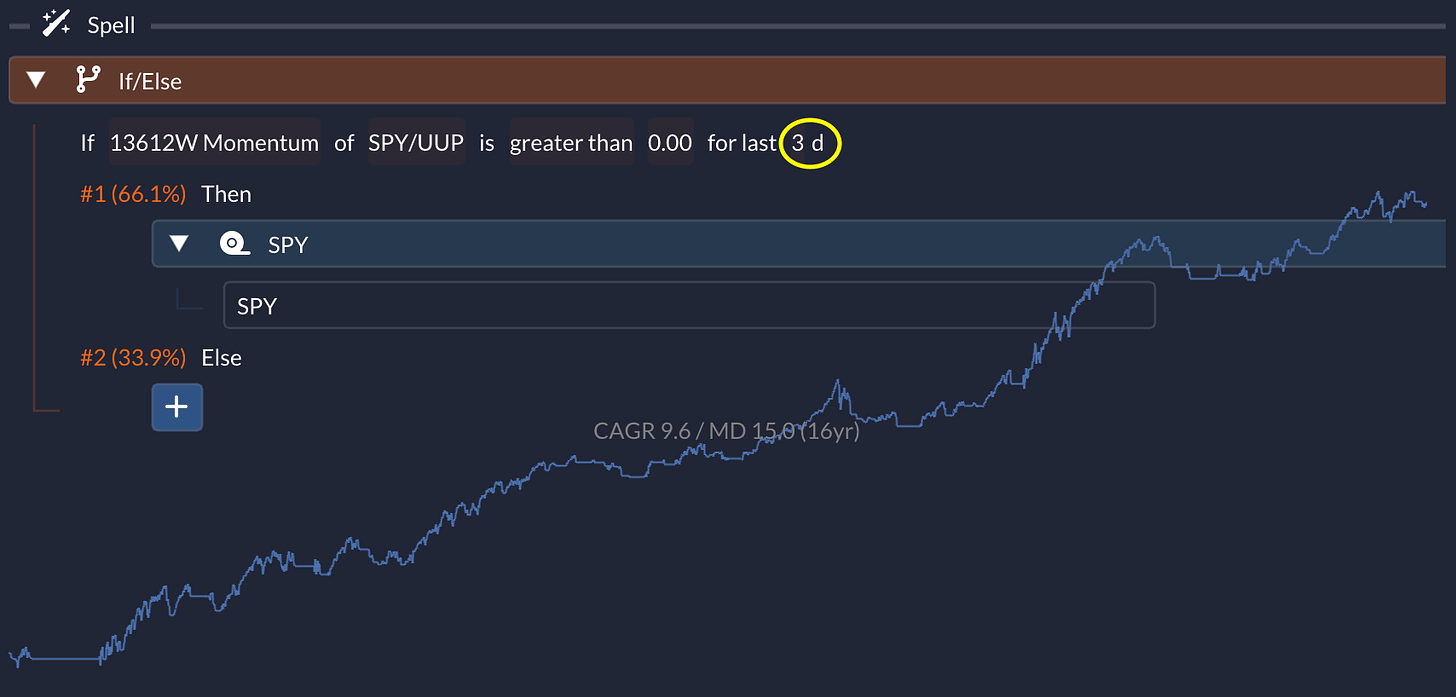
Next up, we pit the S&P 500 against the US dollar index, represented by UUP, using the faster 13612W momentum indicator. By checking for three consecutive days of positive relative momentum, we generate our signal. The simulation over 16 years has returned a 9.6% CAGR with a 15.0% max drawdown—not too shabby for a quick-reacting strategy.
Corporate Bond vs. Treasury Bill
For those with an eye on fixed income, here’s a twist: compare corporate bonds (LQD) to treasury bills (BIL) using the same momentum logic. With a 12.3% CAGR and a 20.1% max drawdown over 16 years, this setup shows some intriguing risk-adjusted returns.
S&P 500 vs. Health Care
How about a defensive twist? In this case, we compare the S&P 500 (using SPY) against a defensive sector like health care, represented by XLV. By checking for five consecutive days of positive momentum, this strategy captures risk-on timing, achieving a 7.8% CAGR with a 15.7% max drawdown over a 25-year period.
Equal Weight vs. Market-cap Weight
Here’s a nod to market breadth. We apply the 13612U momentum indicator to the ratio of RSP (an equal-weight S&P 500 ETF) over SPY. The idea is to switch to RSP when momentum is positive. Over 20 years, this strategy yields an 8.1% CAGR and a 17.2% max drawdown, while only being in the market 43.7% of the time—clearly outperforming the benchmark on a risk-adjusted basis.
Combo Time!
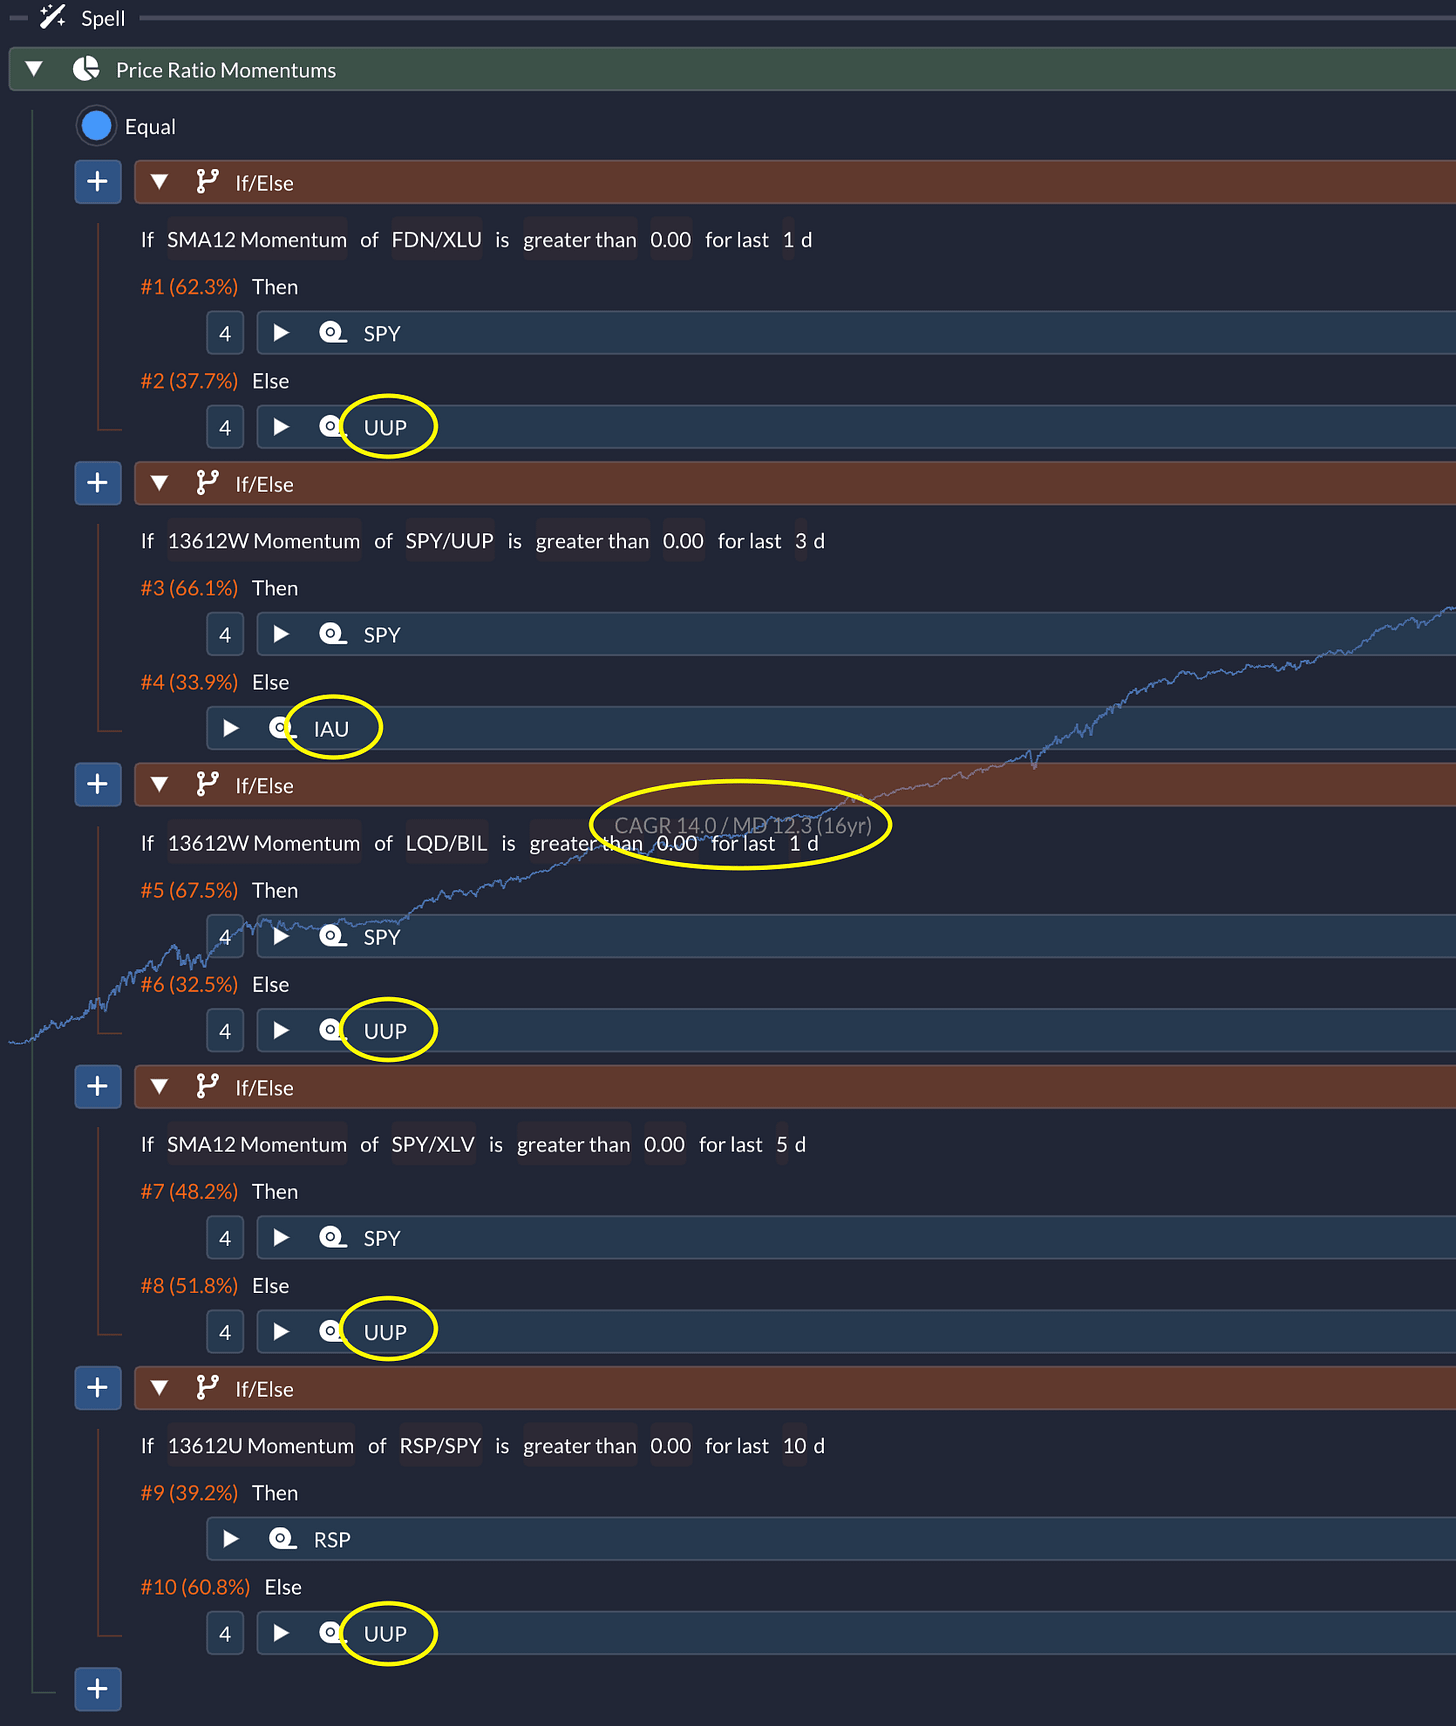
Why settle for one strategy when you can blend them together? By equally weighting these five strategies and assigning proper risk-off assets (like UUP or even IAU as a gold ETF), our combo approach hits a 14.0% CAGR with only a 12.3% max drawdown over 16 years:
And get this—it hasn’t had a single negative year in the period. It’s a real-life “Avengers Assemble” moment for momentum strategies! Give it a whirl yourself here.
So, what do you think? Have you found price ratios to be a useful tool in your own investing toolkit? Are there any other ticker pairs or indicators that you think might unlock even more insights when applied to price ratios? I’d love to hear your thoughts and any ideas you’re itching to test out.


very nice! I'll have the Combo with fries, please. Sorry to ask, because it's probably a silly question: I don't understand UUP as a risk-off asset. Sure, correlations between SPY and UUP are statistically negative, but no strategy I have tested improves in a material manner when UUP is the OOM asset. The price curve of UUP is rather similar to SPY.
Is fun to replace SPY with UPRO...