
Defense First
Why Playing Defense Might Be Your Best Offense

When Risk-Off Assets Call the Shots
Ever notice how most investment strategies are like that friend who’s always “on”—constantly pushing for growth until something goes wrong? Well, I recently stumbled upon a fascinating paper (and a related post) that completely flips this approach on its head.
The strategy? It’s called “Defense First,” and instead of charging ahead with risk-on assets until they stumble, it does something refreshingly counterintuitive: it stays defensive by default and only ventures into equities when the safe havens start looking shaky.

Here’s the defensive dream team the strategy employs:
TLT - Long-Term Treasuries (your classic safety net)
GLD - Gold (the timeless hedge)
DBC - Commodities (for when things get real)
UUP - U.S. Dollar Index (cash is still king, sometimes)
Each gets evaluated using dual momentum (relative + absolute), and if their mojo fades, the portfolio shifts into SPY—not because it’s exciting, but because it’s the “least weak alternative.”
Here’s how it works in the original paper:
Because no research rabbit hole goes un‑explored around here, I wired the whole thing into QuantMage—but with one twist: I used threshold rebalancing instead of a simple calendar‑month flip.
Implementing Dual Momentum in QuantMage
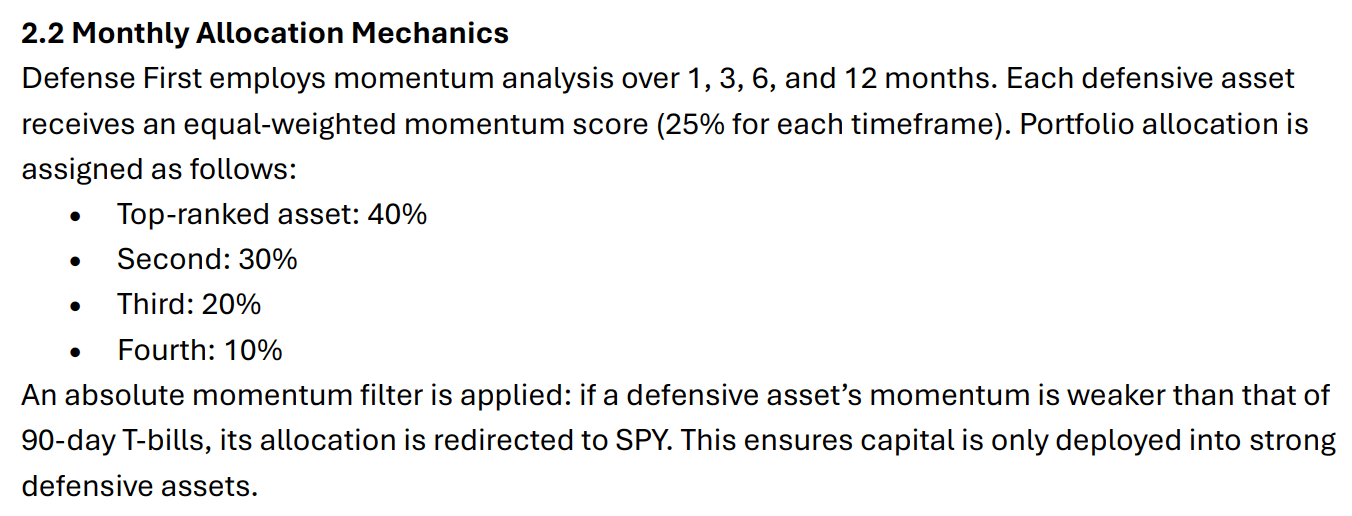
To mirror the dual momentum approach, I started with a Filtered incantation using 13612U Momentum as the ranking indicator with weights from the original paper.
To handle the absolute momentum (i.e., when to stick with a defensive asset vs. rotate into SPY), I leaned on price ratio momentums with short-term T-Bills:
The results? A respectable 9.5% CAGR with a 12.7% max drawdown over 16 years. Not too shabby, and pretty much in line with what the paper found.
Note: Unlike the paper’s approach, which ranked each raw asset, ranking here is done for each absolute-momentum subspell under the Filtered as a whole.
Enter: Indicator Percentile
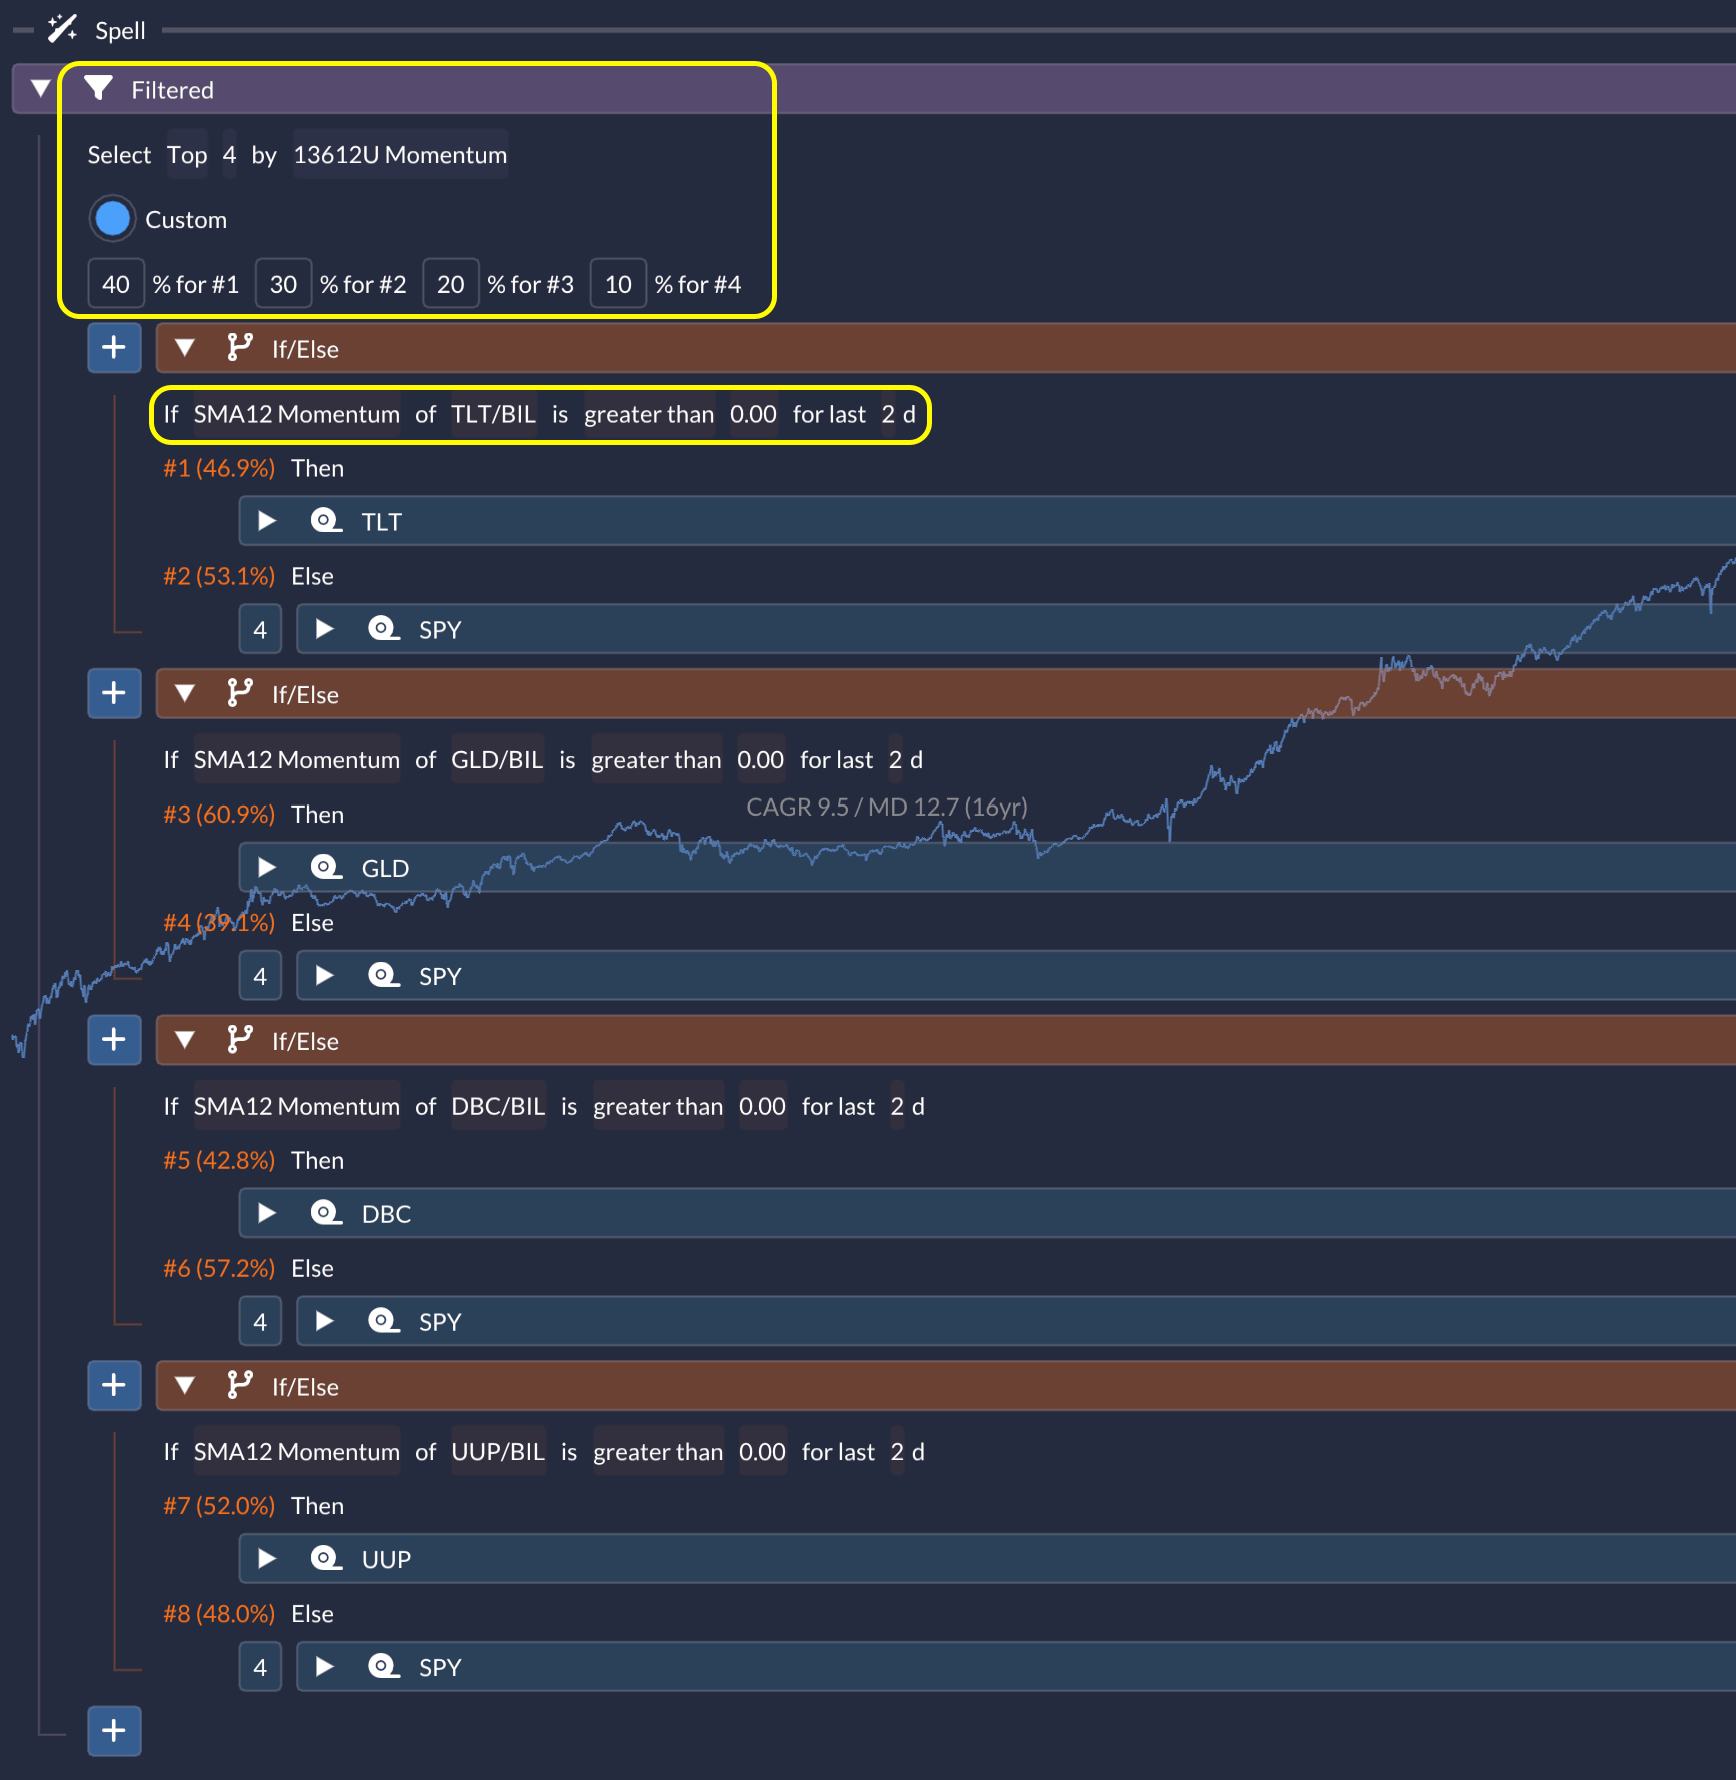
QuantMage recently rolled out a slick new toy: Indicator Percentile. It lets you ask, “How strong is this indicator vs. its recent history?”—a natural fit for momentum systems.
So instead of checking if the price ratio’s momentum is just above zero (like with SMA12), I asked: Is the 10-day moving average of the price ratio in the top half of its last 100 days?
If yes, we keep the asset. If not, we rotate to SPY:
Boom! We’re looking at 12.2% CAGR with a 13.3% max drawdown. That’s a meaningful jump just from tweaking our momentum signals.
⚠️ Heads‑Up: None of this is investment advice. It’s a sandbox for strategy nerds. Do your own homework (and maybe call your favorite fiduciary) before pulling any triggers.
Inverse Volatility Weighting
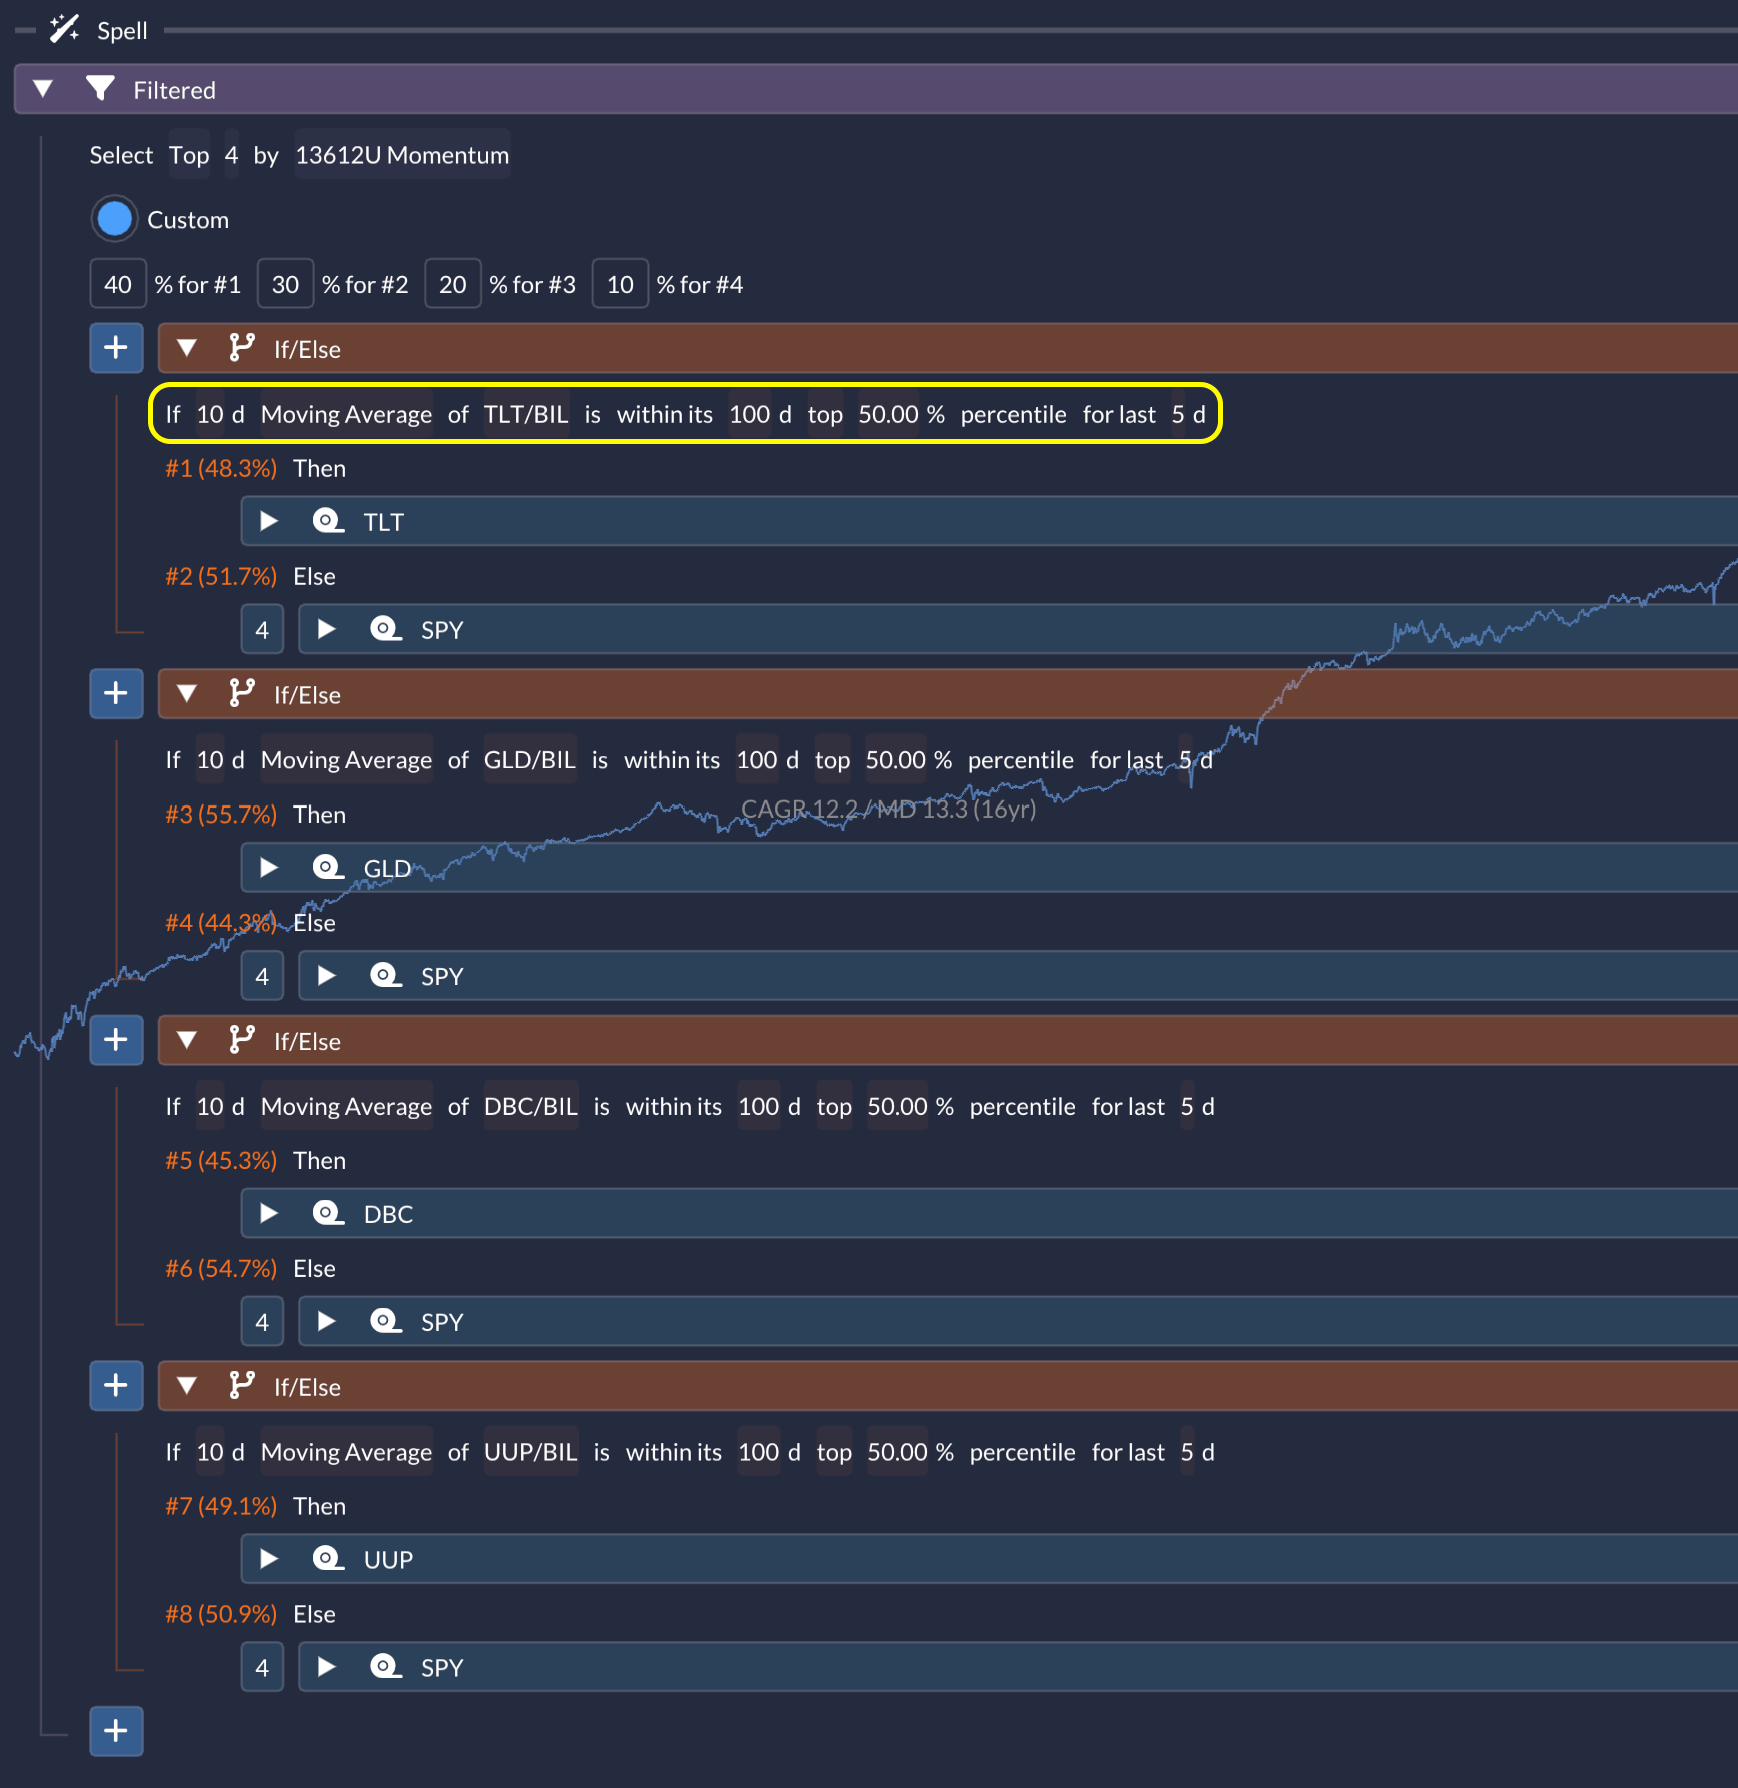
Next, I wondered what would happen if we ditched the relative momentum component entirely and went with inverse volatility weighting instead. Think of it as giving more weight to the calm kids in class:
At first glance, the 11.4% CAGR and 18.2% max drawdown looked like a step backward. But wait for it...
Turning Up the Heat
Replacing SPY with SPXL (3× leveraged S&P 500) turned the 🚴♂️ ride into a 🏎️ joy‑ride:
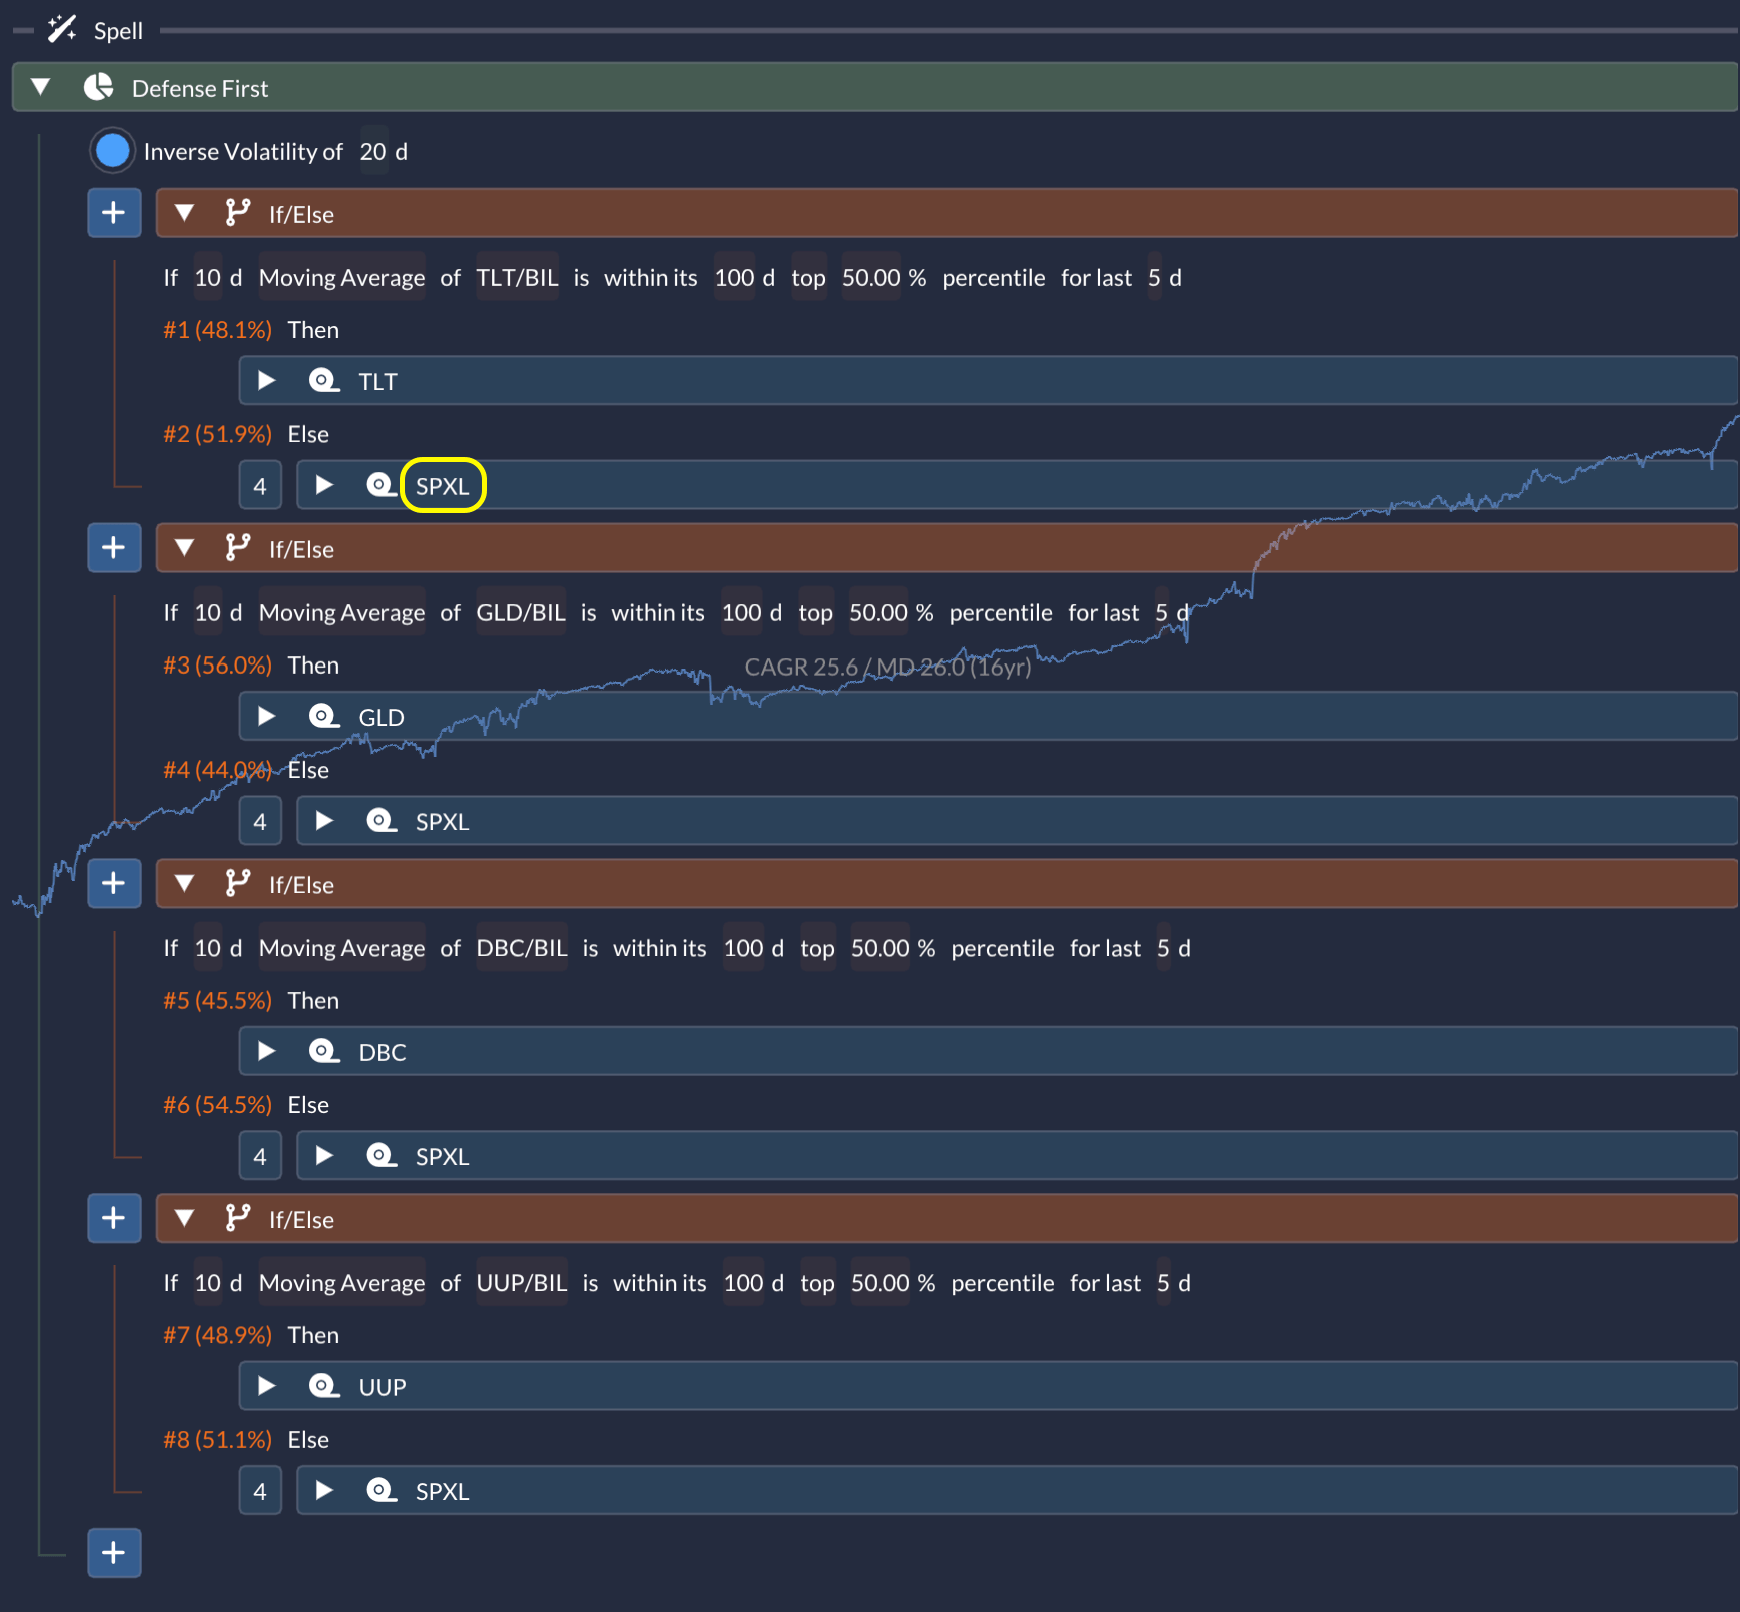
We’re talking 25.6% CAGR with a 26.0% max drawdown! The Sharpe Ratio hits 1.23 with 20.2% annualized volatility. And here’s the plot twist—this leveraged version actually performs better with inverse volatility weighting than with the original relative momentum filter.
Want to take this bad boy for a spin? 👉 Check it out here.
So, What’s the Verdict?
My take on “Defense First” may not be a pixel-perfect replica of the paper, but it captures the key concepts—dual momentum, defensive default posture, dynamic SPY fallback—and delivers comparable or even stronger performance.
Does staying risk-off until proven otherwise appeal to your investing instincts? How do you feel about percentile-based signals vs. traditional momentum? Got a tweak or variation of your own?
Drop a comment—I’d love to hear how you’d enchant this spell differently.
Hello, nice analysis! I appreciate you engaging with the paper (I am the author). I like the way you tweaked the parameters (esp. the inverse vol weighting). I had played around with leverage as well, and had found that QLD was kind of my risk "sweet spot". What I like about the framework is that there are quite a few ways to take it. Thanks! --Tom Carlson