VIX as a Canary, Round Two
Using VIX/VIX3M with Aroon-Up
Have you ever had a friend who’s always on high alert, convinced danger lurks around every corner—only to suddenly shrug and say, “Eh, nothing to see here”? The CBOE Volatility Index (VIX) sometimes feels like that: it’s supposed to spike when the market is in trouble. But when it doesn’t, it can be a surprising signal that maybe things aren’t so dire. I shared a couple of VIX-based signals before, and recently I stumbled on two more interesting articles (Part I and Part II) that got me thinking.
Unfortunately, real-time VIX data got removed from QuantMage. But I discovered that the Federal Reserve’s FRED service has historical data for both VIX and VIX3M (with a one-day lag). So naturally, I plugged that into QuantMage and decided to run a few experiments. Let’s see what happened.
VIX Subsiding
Usually, as the S&P 500 (SPX) makes lower lows, VIX tends to make higher highs. When that relationship breaks and VIX doesn’t spike to new highs, some folks see that divergence as a market-bottom signal.
My attempts to directly replicate that “diverging VIX” idea in QuantMage didn’t yield anything too mind-blowing. But there’s another angle: what if we measure how far VIX is from its local peak? For that, I used a 20-day Aroon-Up indicator to see if VIX was “more than 16 days away from its 20-day high” (a fancy way of saying VIX has been dropping off its peak for a while). In simpler terms: if VIX has subsided enough from a recent high, that might signal it’s safer to go risk-on. It goes risk-off once SPY’s price crosses down its 200-day moving average.
Here’s what that strategy’s equity curve looks like:
31-year absolute return: slightly below SPY buy-and-hold
Drawdown & volatility: much lower than buy-and-hold
Market exposure: only 75.3% of the time
So while it’s not beating pure buy-and-hold on total returns, it does provide a smoother ride. If you’re interested, you can check out the strategy right here.
VIX Backwardation
Now, onto the second idea: using both VIX and VIX3M. If you’re unfamiliar, VIX3M is a 3-month forward implied volatility index, while VIX is the 1-month forward version. Since longer-dated options inherently carry more uncertainty, VIX3M typically runs higher than VIX. But sometimes, VIX momentarily spikes above VIX3M, a situation known as “backwardation.” This can be a contrarian signal that the market is, dare we say, a bit too panicked right now.
Here’s a look at the ratio of VIX to VIX3M:
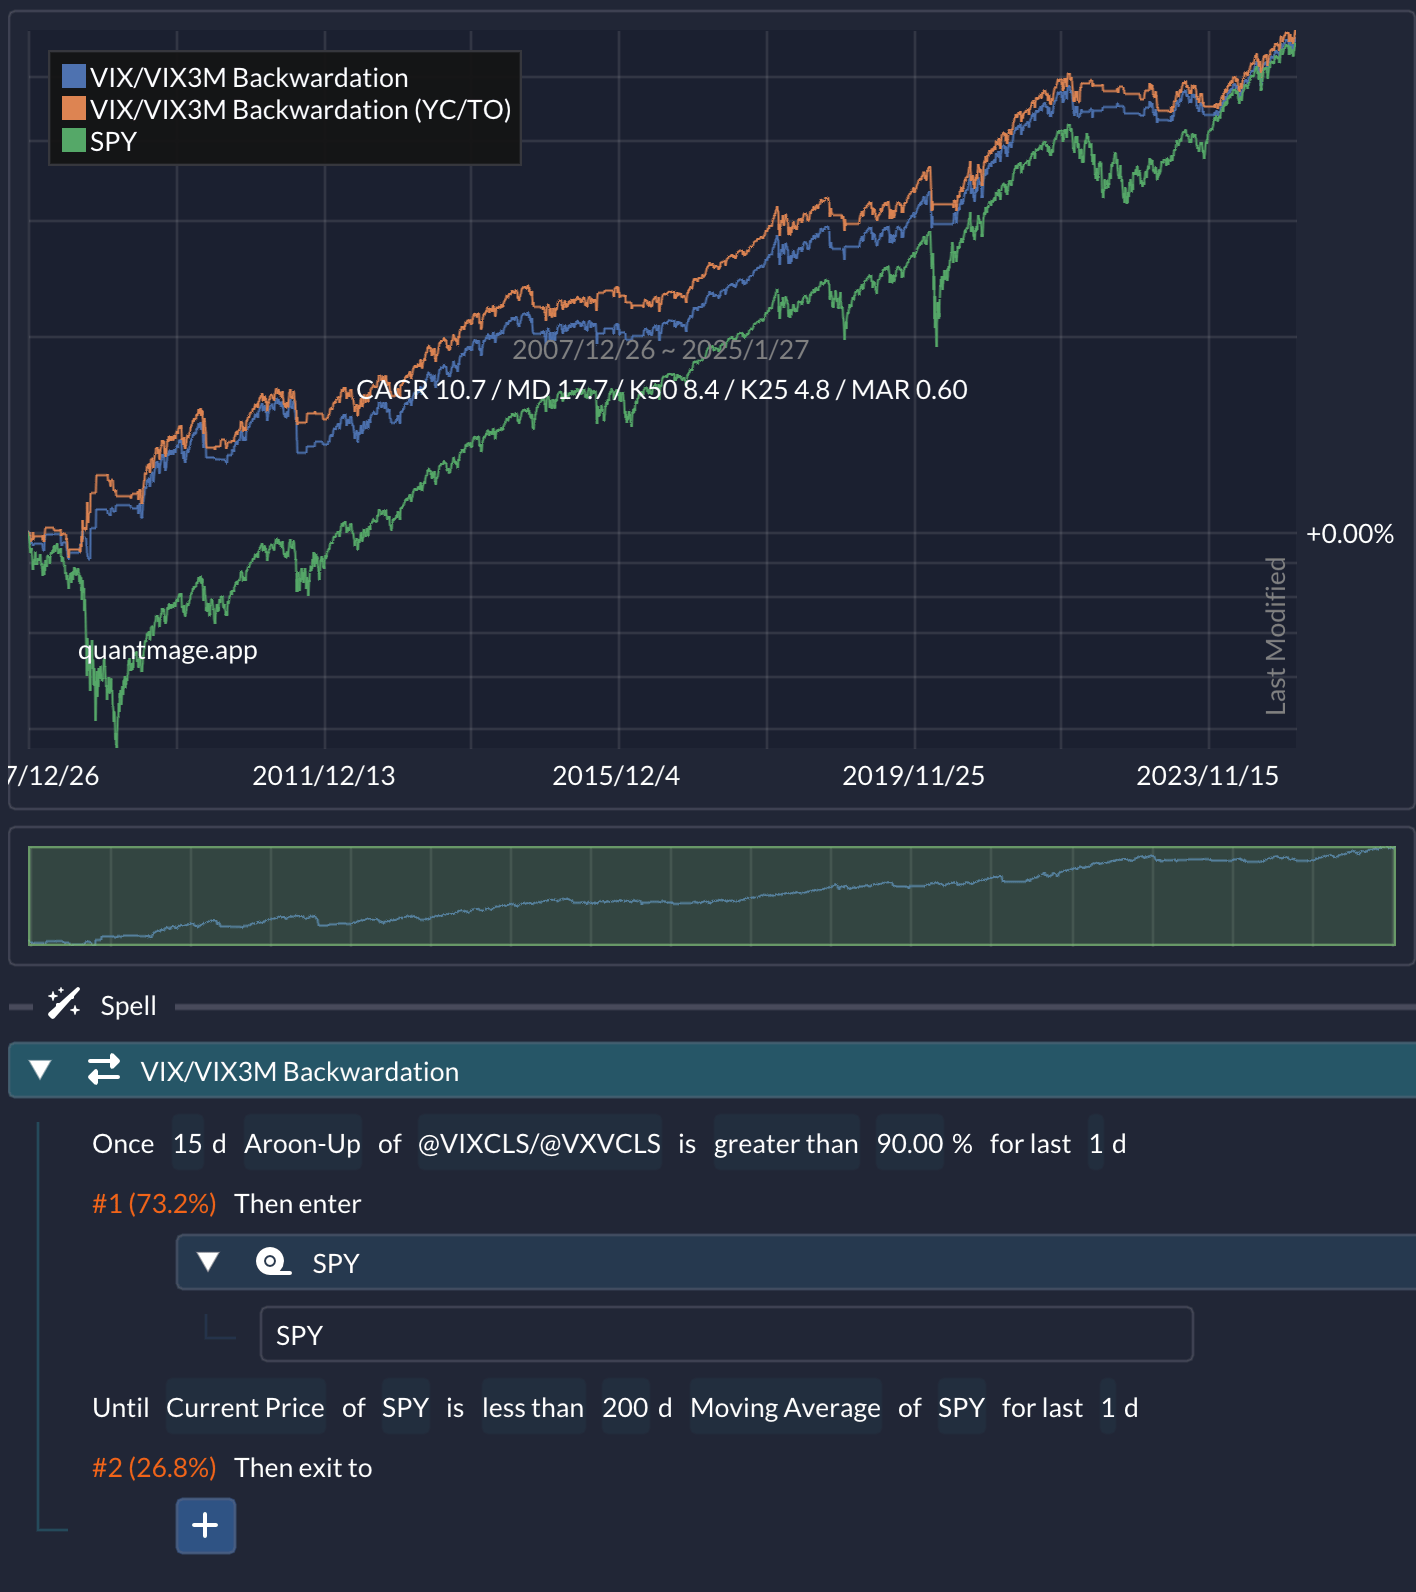
You can see how sudden spikes in that ratio often happen alongside major market drawdowns. My previous post on the topic showcased a strategy comparing this ratio to a fixed number. But now that QuantMage supports price ratio data, you can get more creative—using all sorts of indicators on the ratio directly. For example, I tried a 15-day Aroon-Up to see if the ratio of (VIX / VIX3M) hit a new high either today or yesterday. If so, the strategy goes risk-on.
The result? Over a 17-year test period, this approach outperforms buy-and-hold on a risk-adjusted basis (and even beats it on total returns) while only being in the market 73.2% of the time. Here’s the link to try the strategy for yourself. Feel free to tweak it and see how it compares to your own ideas.
Conclusion
So what do you think? Are these results exciting enough to consider? Even though FRED’s data has a one-day lag, it might still be valuable for slower-to-medium-frequency strategies. Do you have a different take on how to track a “subsiding” VIX or how to detect VIX backwardation? And how might QuantMage’s new price ratio support spark fresh approaches to these signals (or totally different signals altogether)?
I’d love to hear your thoughts—share them by replying to this post or dropping me a note. 💬👇
📣 Disclaimer: This content is purely informational. It’s not investment advice or a recommendation to buy or sell any stocks. Always do your own research and consider talking to a financial professional before making any moves.


You might want to check out the idea of using a 200-day Aroon Up on the VIX as an entry to UVXY and tranche that into two or three short-term Aroon Downs (1, 2, 3 days) as exits. This may be a decent tail risk overlay for the big crashes where the insurance payment isn't overwhelming. It only rarely triggers and gets out quickly as the spike is dying. It wasn't until reading some of your things that I realized the algorithm I got the idea from was based on the Aroon indicators. I have a plot at the end of my bogleheads thread.
You might want to check out some of the strategies at simplevix.com for some ideas. There is one that uses the VIX/VIX3M ratio (https://simplevix.com/vix-vs-vix3m/) to trade long and short volatility rather than for market entry. There are some other interesting strategies too.
I won't precisely use these strategies myself, but they give a good starting point for ideas.
I'm thinking of one that might use SVXY with short-term signals (maybe 70% average investment), UVXY for infrequent events (<2% invested), and SGOV for out of market.