
Three Tidbits 12/11/2024

I’ve recently been tinkering with a few strategy ideas I stumbled upon (or half-invented) that I thought might be interesting to share. They’re all pretty straightforward, and while I’m not saying they’ll make anyone rich overnight, they’re worth a look if you’re into strategy design.
Stock/Bond/Cash Rotation
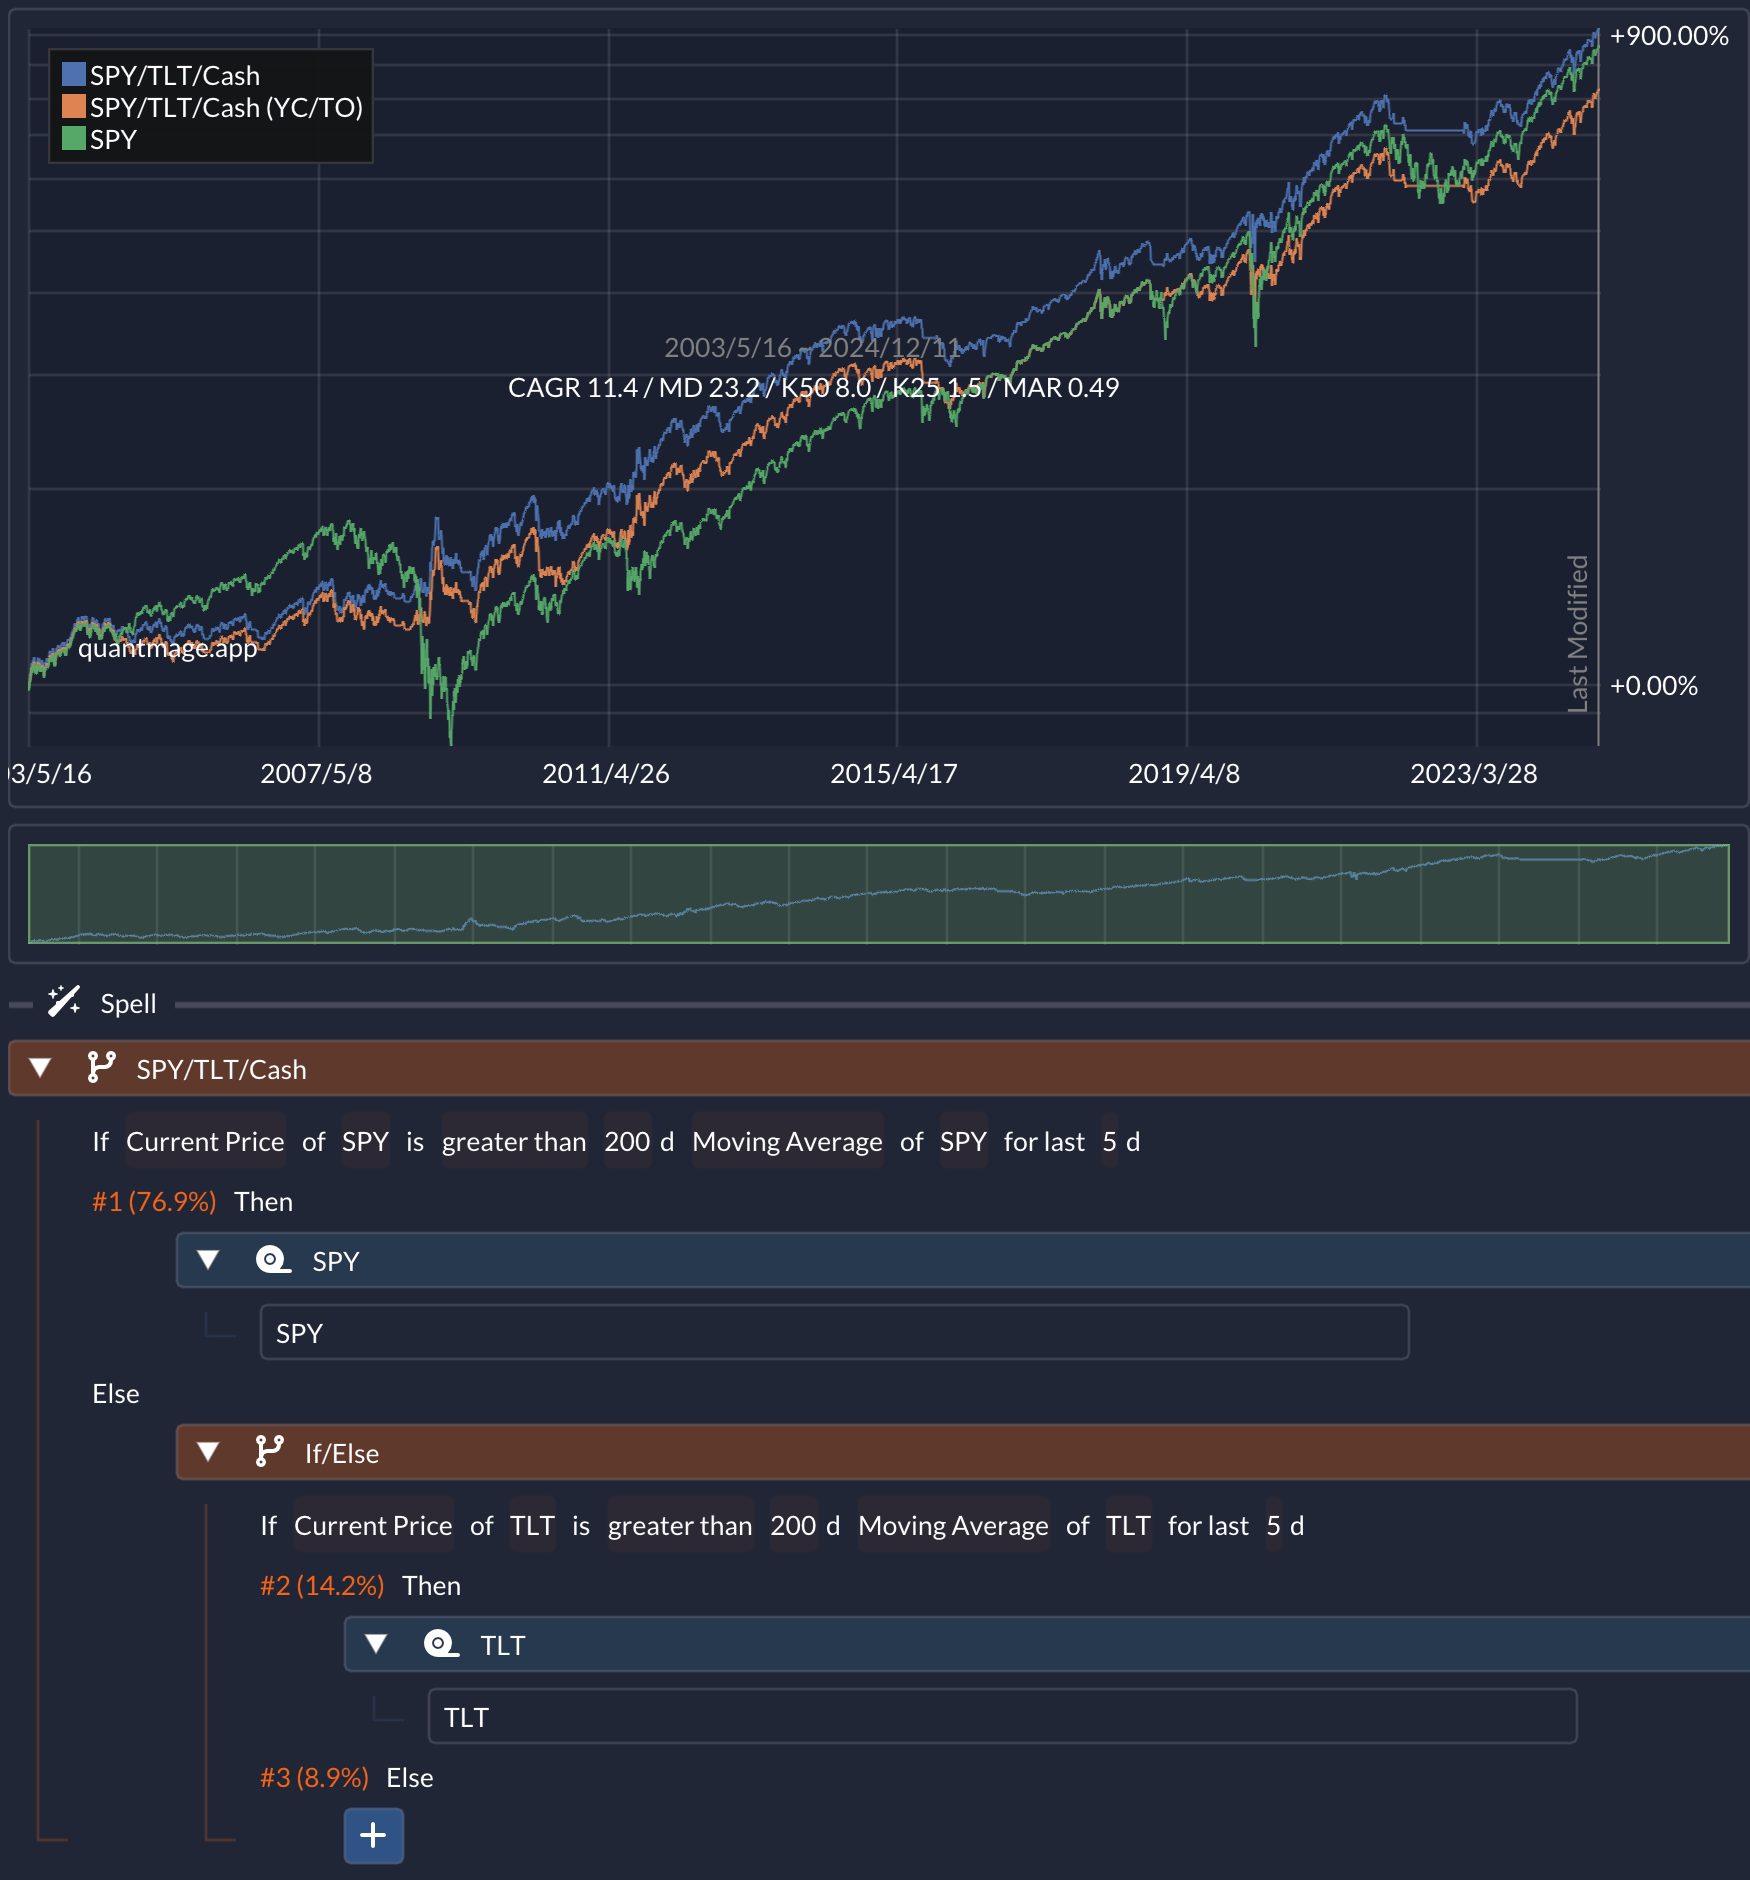
This idea was inspired by a post on Alvarez Quant Trading. The original concept rotates between stocks and bonds based on the stock market’s 200-day moving average (MA) crossover, and even suggests leveraging stocks when volatility (VIX) is low. My take was to extend that logic: not only check the stock side’s signal, but apply the same 200-day MA crossover rules to bonds as well. If both stocks and bonds are out of favor, head to cash. This tweak matters in periods when stocks and bonds move together (like in recent years). A quick QuantMage backtest over 21 years showed a decent risk-adjusted return:
Breadth Thrust
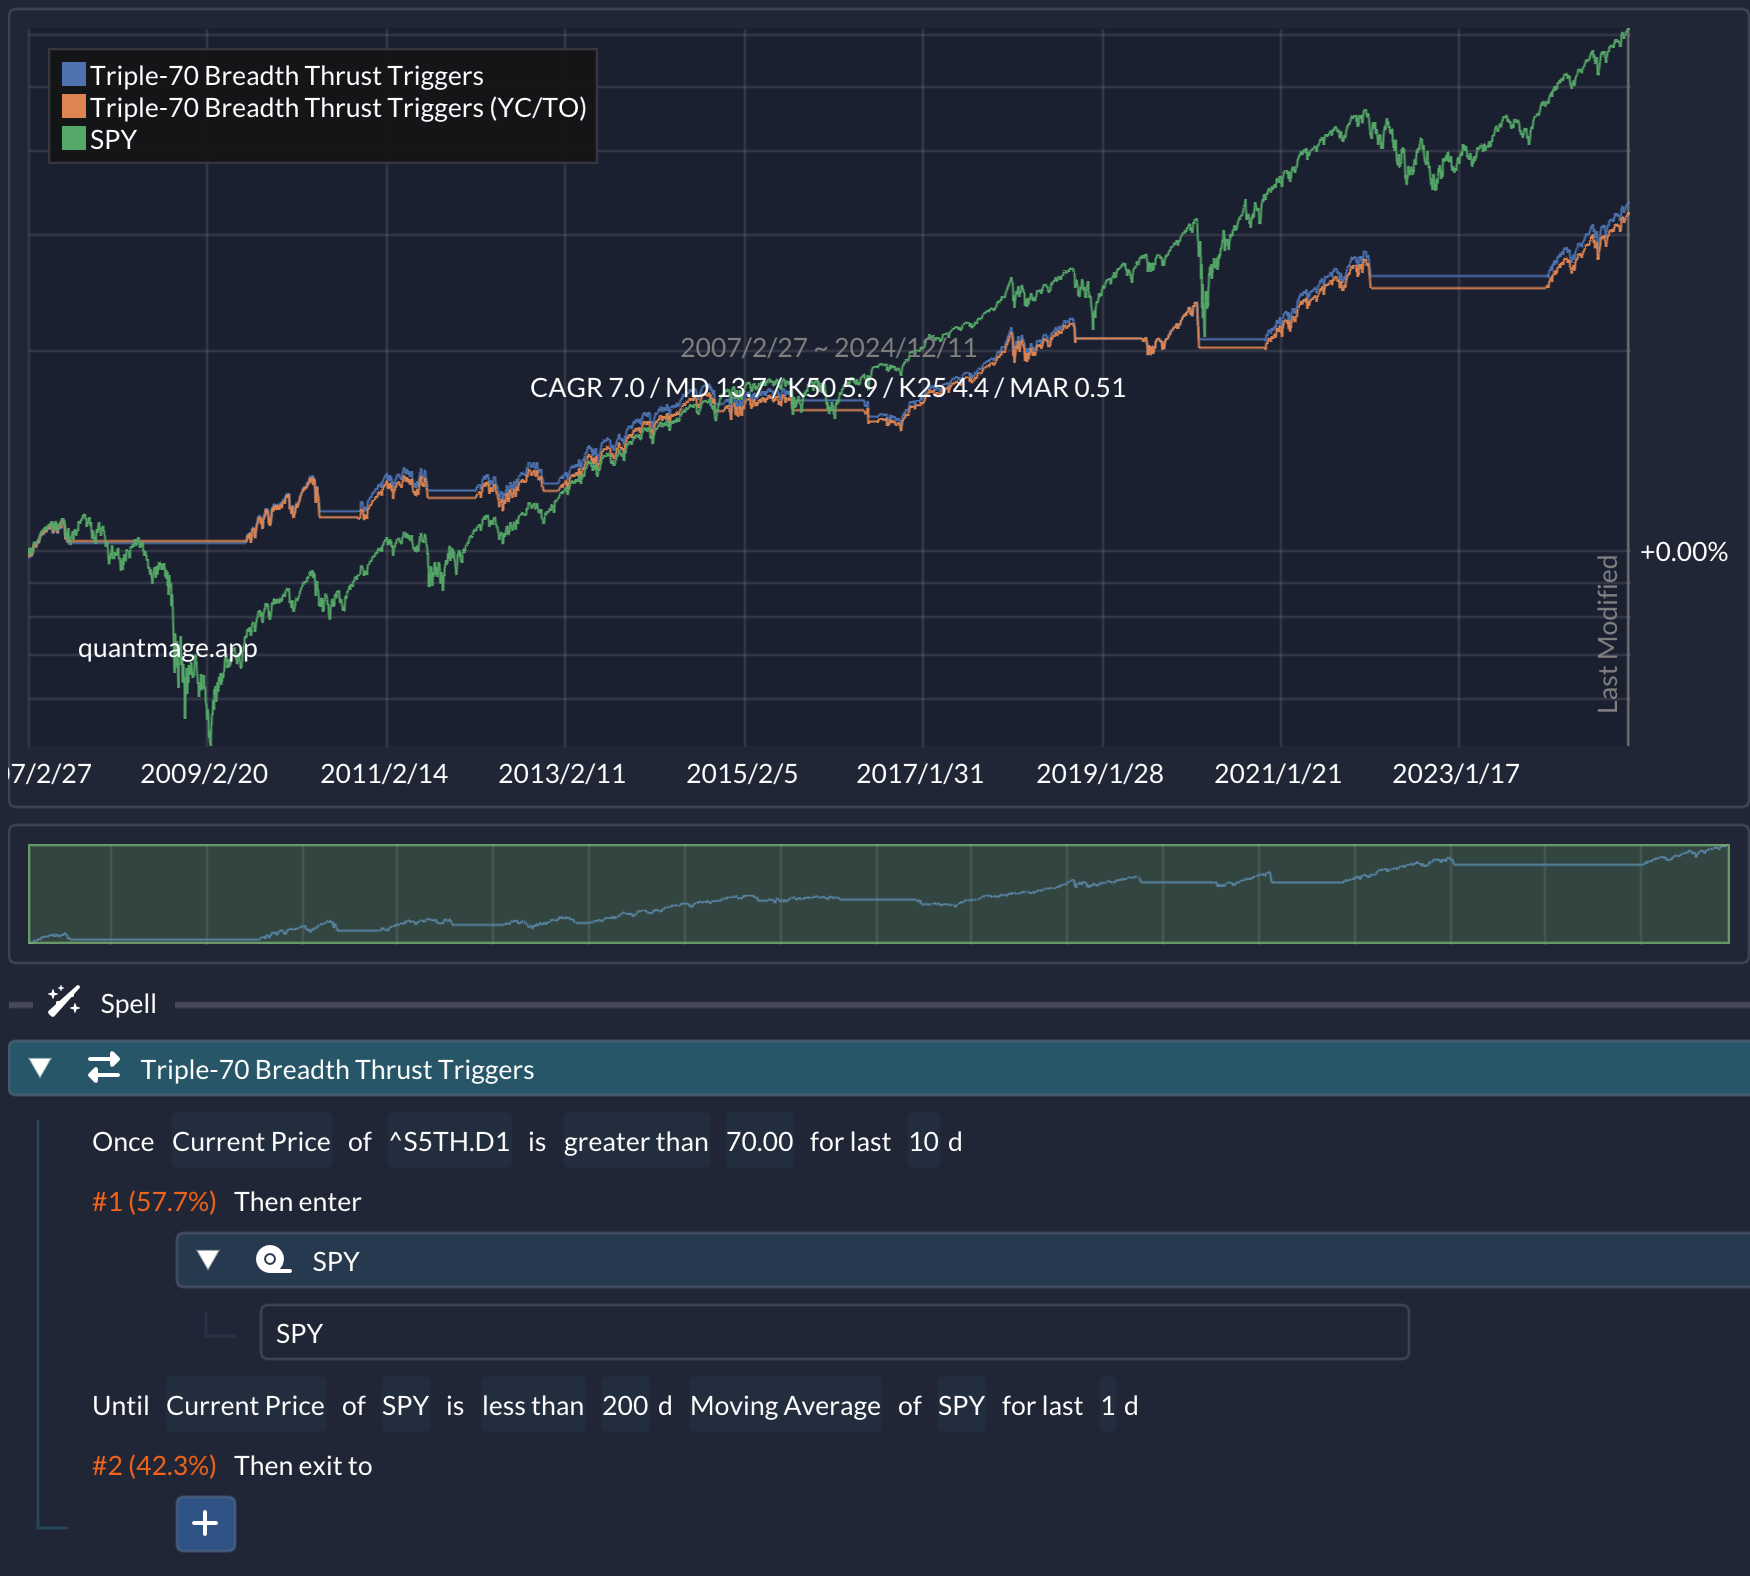
From a post on Quantifiable Edges, I came across the “Triple-70 Breadth Thrust” signal. Basically, it triggers when the percentage of NYSE stocks closing higher reaches at least 70% for three straight days. Historically, buying SPY after this signal and holding for 80 days looked solid in their tests.
I adapted this idea using the S5TH (S&P 500 Stocks Above 200-Day Average) as a breadth metric, and instead of holding for a fixed number of days, I used a 200-day MA crossover check for going risk-off. The result was another strategy with decent risk-adjusted returns over 17 years:
Flattening Yield Curve
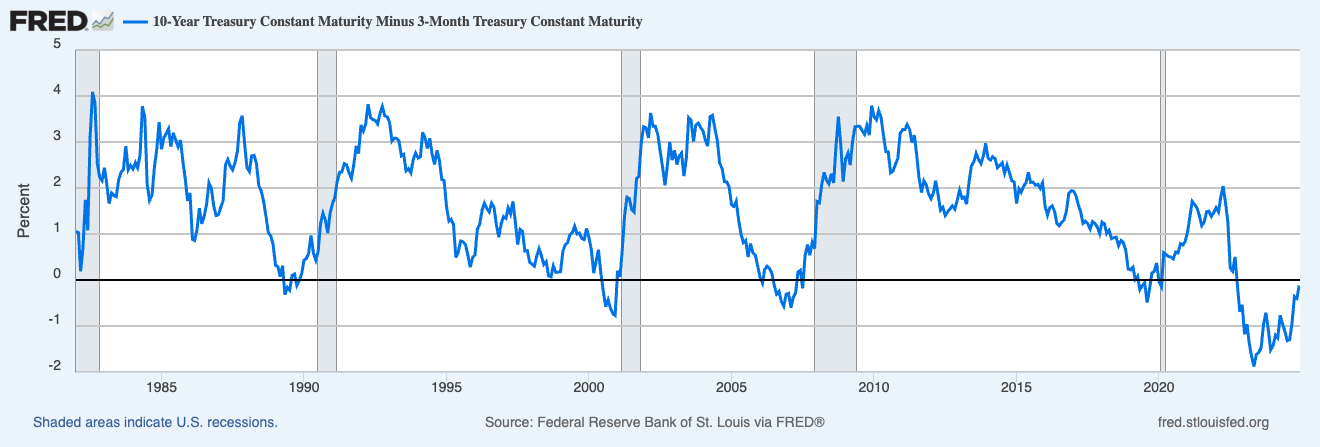
This one’s my own experiment. The yield spread between the 10-year Treasury and the 3-month T-bill tends to rise quickly during recessions and slowly diminish (i.e. the yield curve flattens) during healthier economic times. Eventually, the curve can even invert (i.e. the spread goes negative), which often hints at a recession on the horizon:
I built a simple exponential moving average (EMA) crossover system to identify these flattening periods:
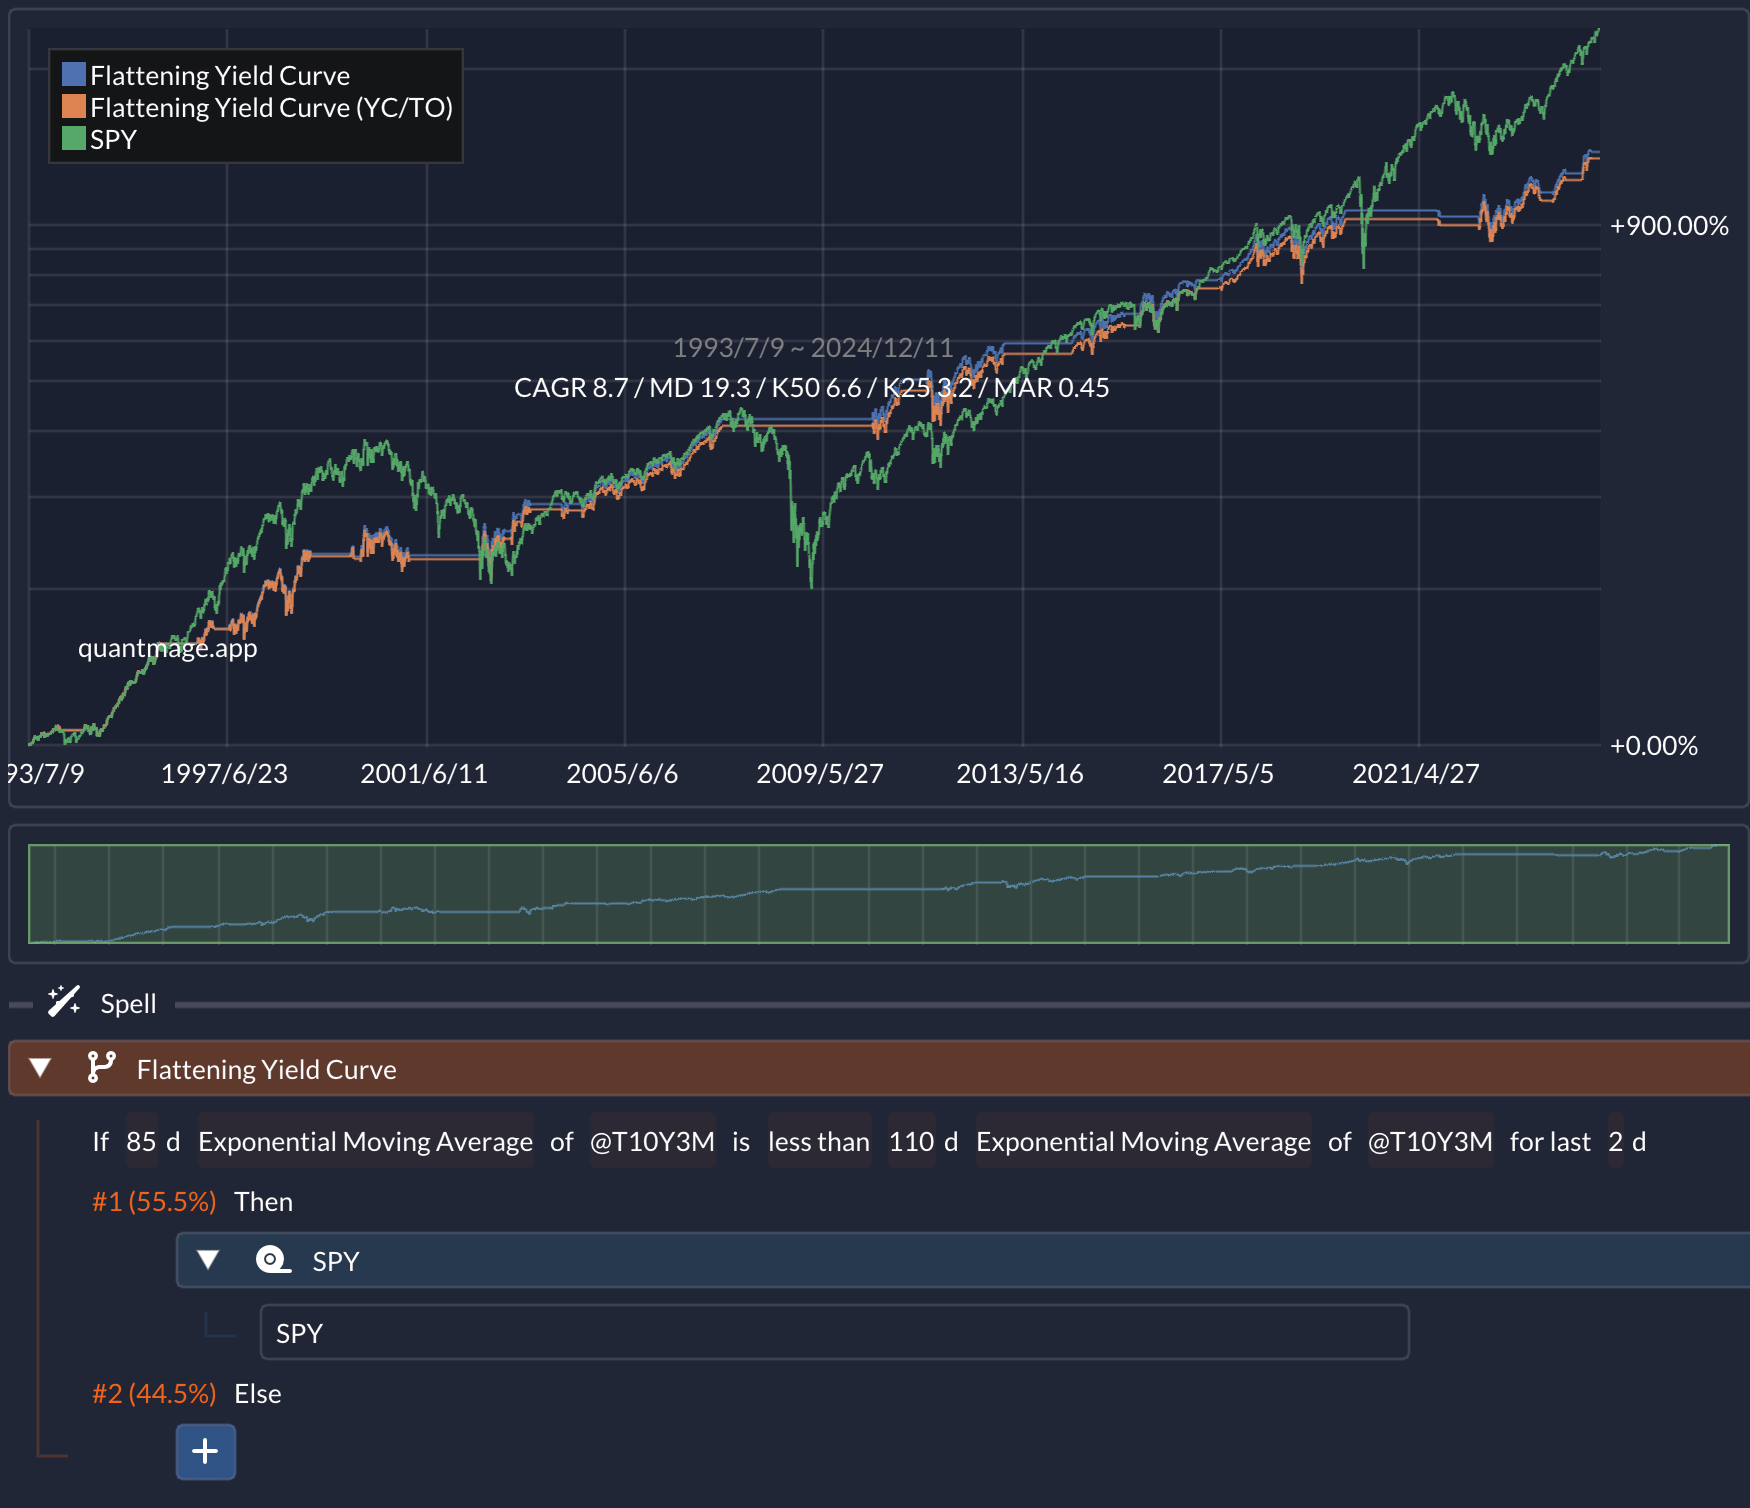
Over a 31-year test period, it performed pretty well. However, I should mention the potential for overfitting—I fine-tuned parameters like EMA windows to get better results, so keep a healthy dose of skepticism handy.
So, which of these catches your eye the most? If you decide to run your own tests or variations, I’d love to hear what you find.
📣 Quick disclaimer: This is all informational, not a recommendation to buy or sell anything. Always do your own research and consider consulting a professional if you’re unsure.
great stuff!
Is this your favorite kind of breadth thrust?
I like a Zweig. Buy when 10-day of NYSE advances moves from below .40 to above 0.615 within 4 trading days or less. Hold for a year.
I also like a Deemer/Lowry. One 90% upside day, or two or more back-to-back 80% upside days. Indicative of a major market low, hence hold for a year.