
The Nuanced Art of Adjusted Prices
Discovering the challenge in finding a reliable provider of historical price data

A stock value isn't just influenced by market fluctuations, but also dividends and splits. When refining your stock investment approach or (even more critical) streamlining your trades based on it, employing properly adjusted price data is fundamentally significant. Neglecting this detail may lead to the misfiring of indicators or signals in the strategy, incurring undue allocations, and therefore impacting its overall performance.
To illustrate this point, let's peek at the BIL chart on TradingView. It offers a convenient way to switch the price adjustment:
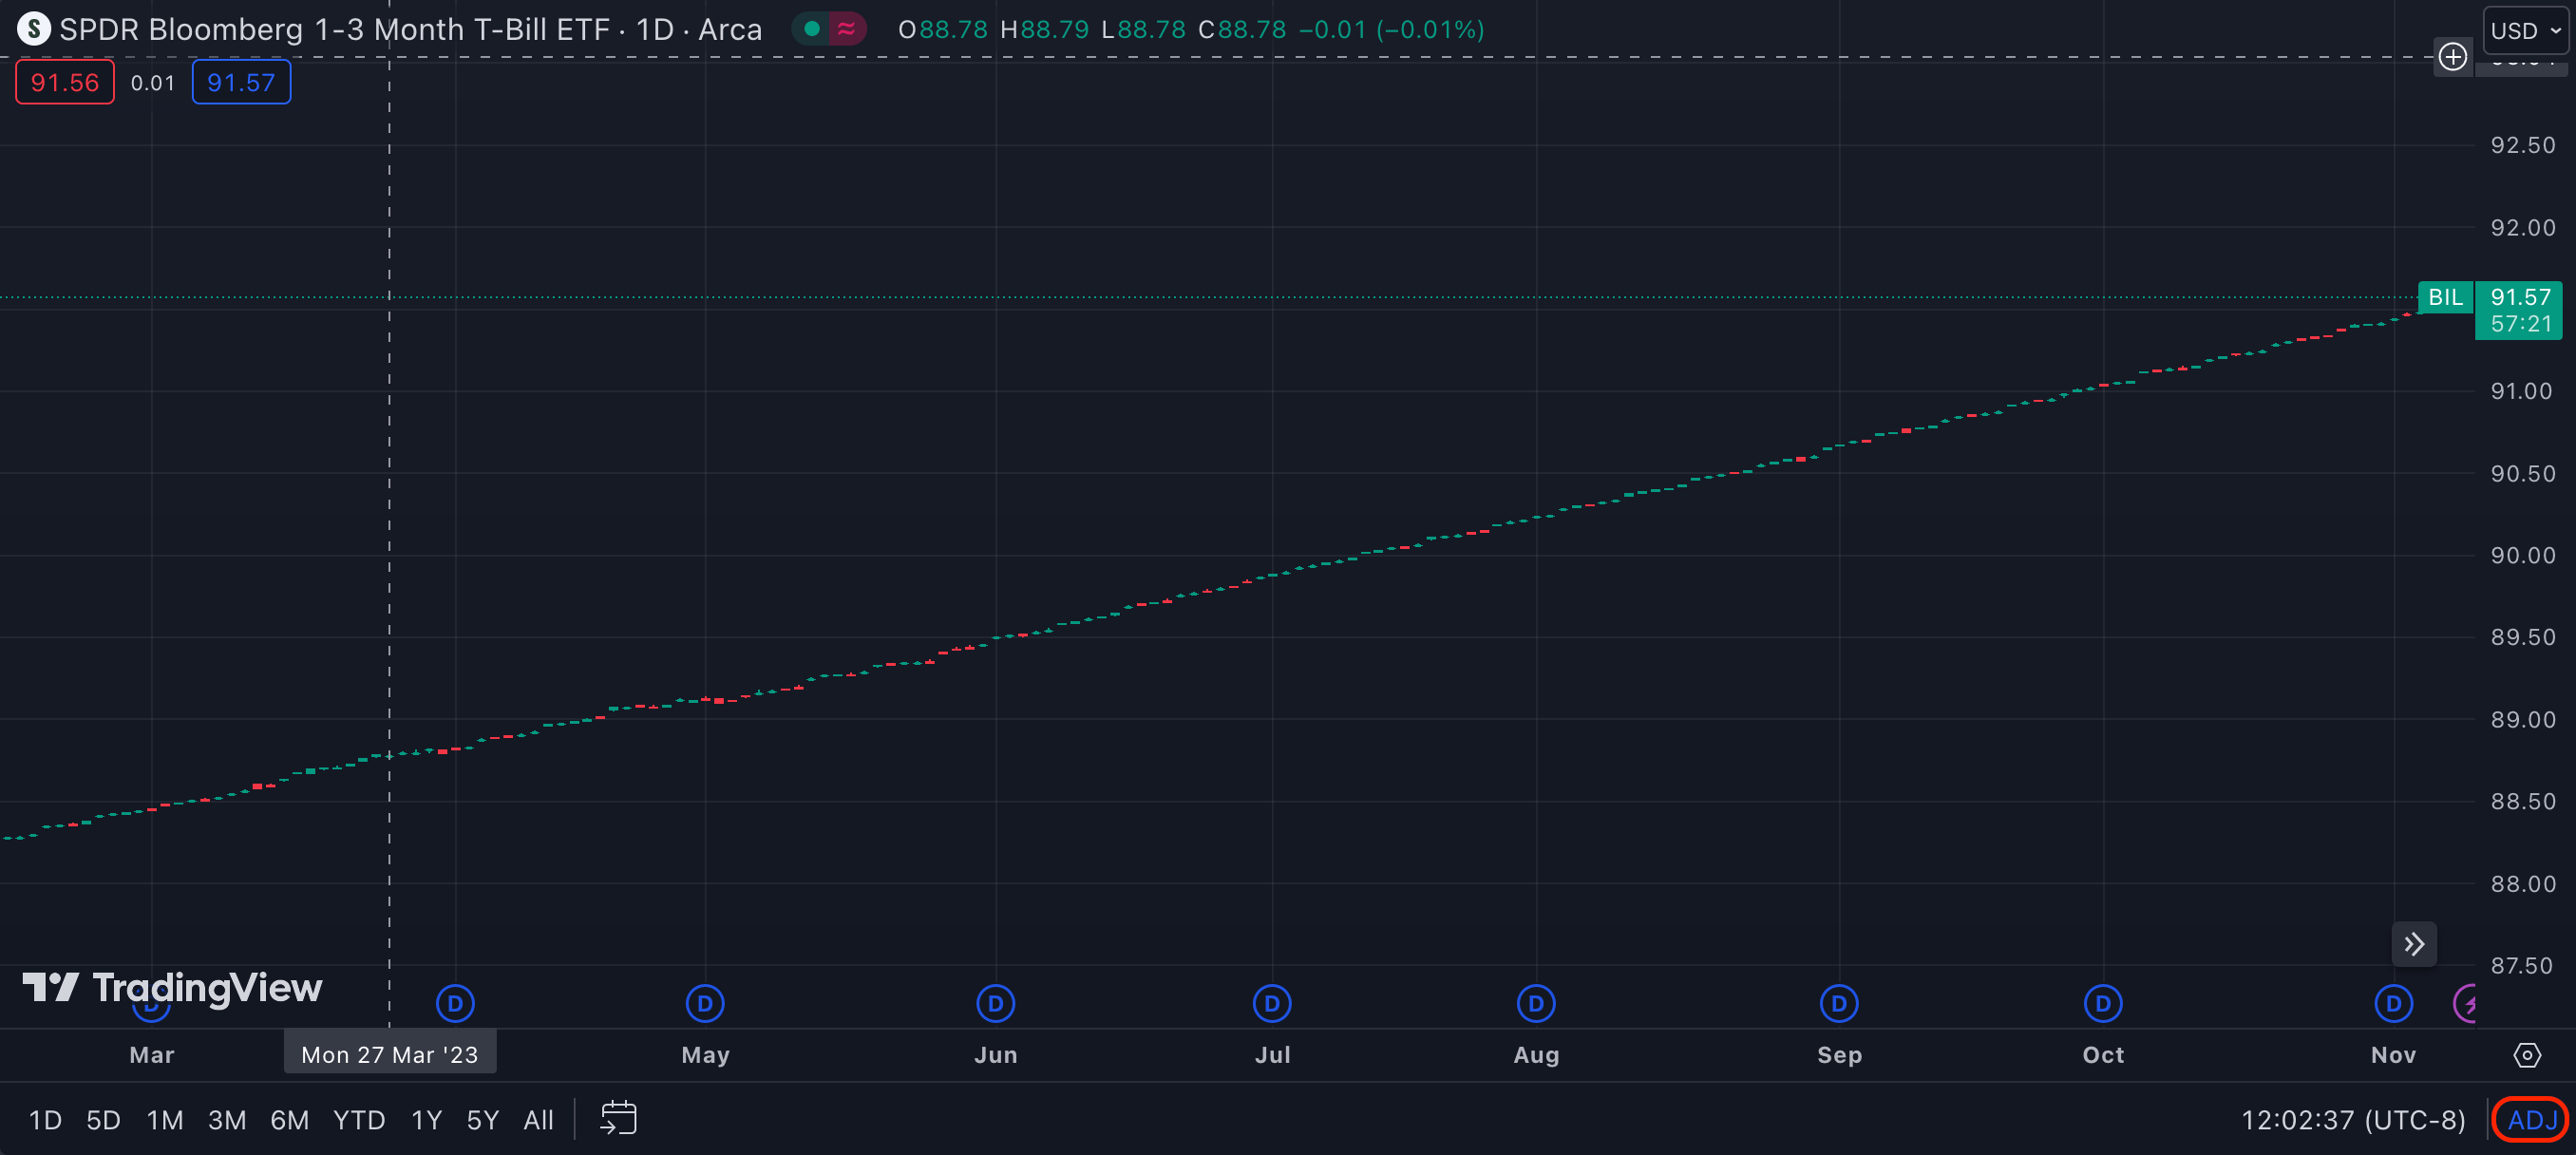
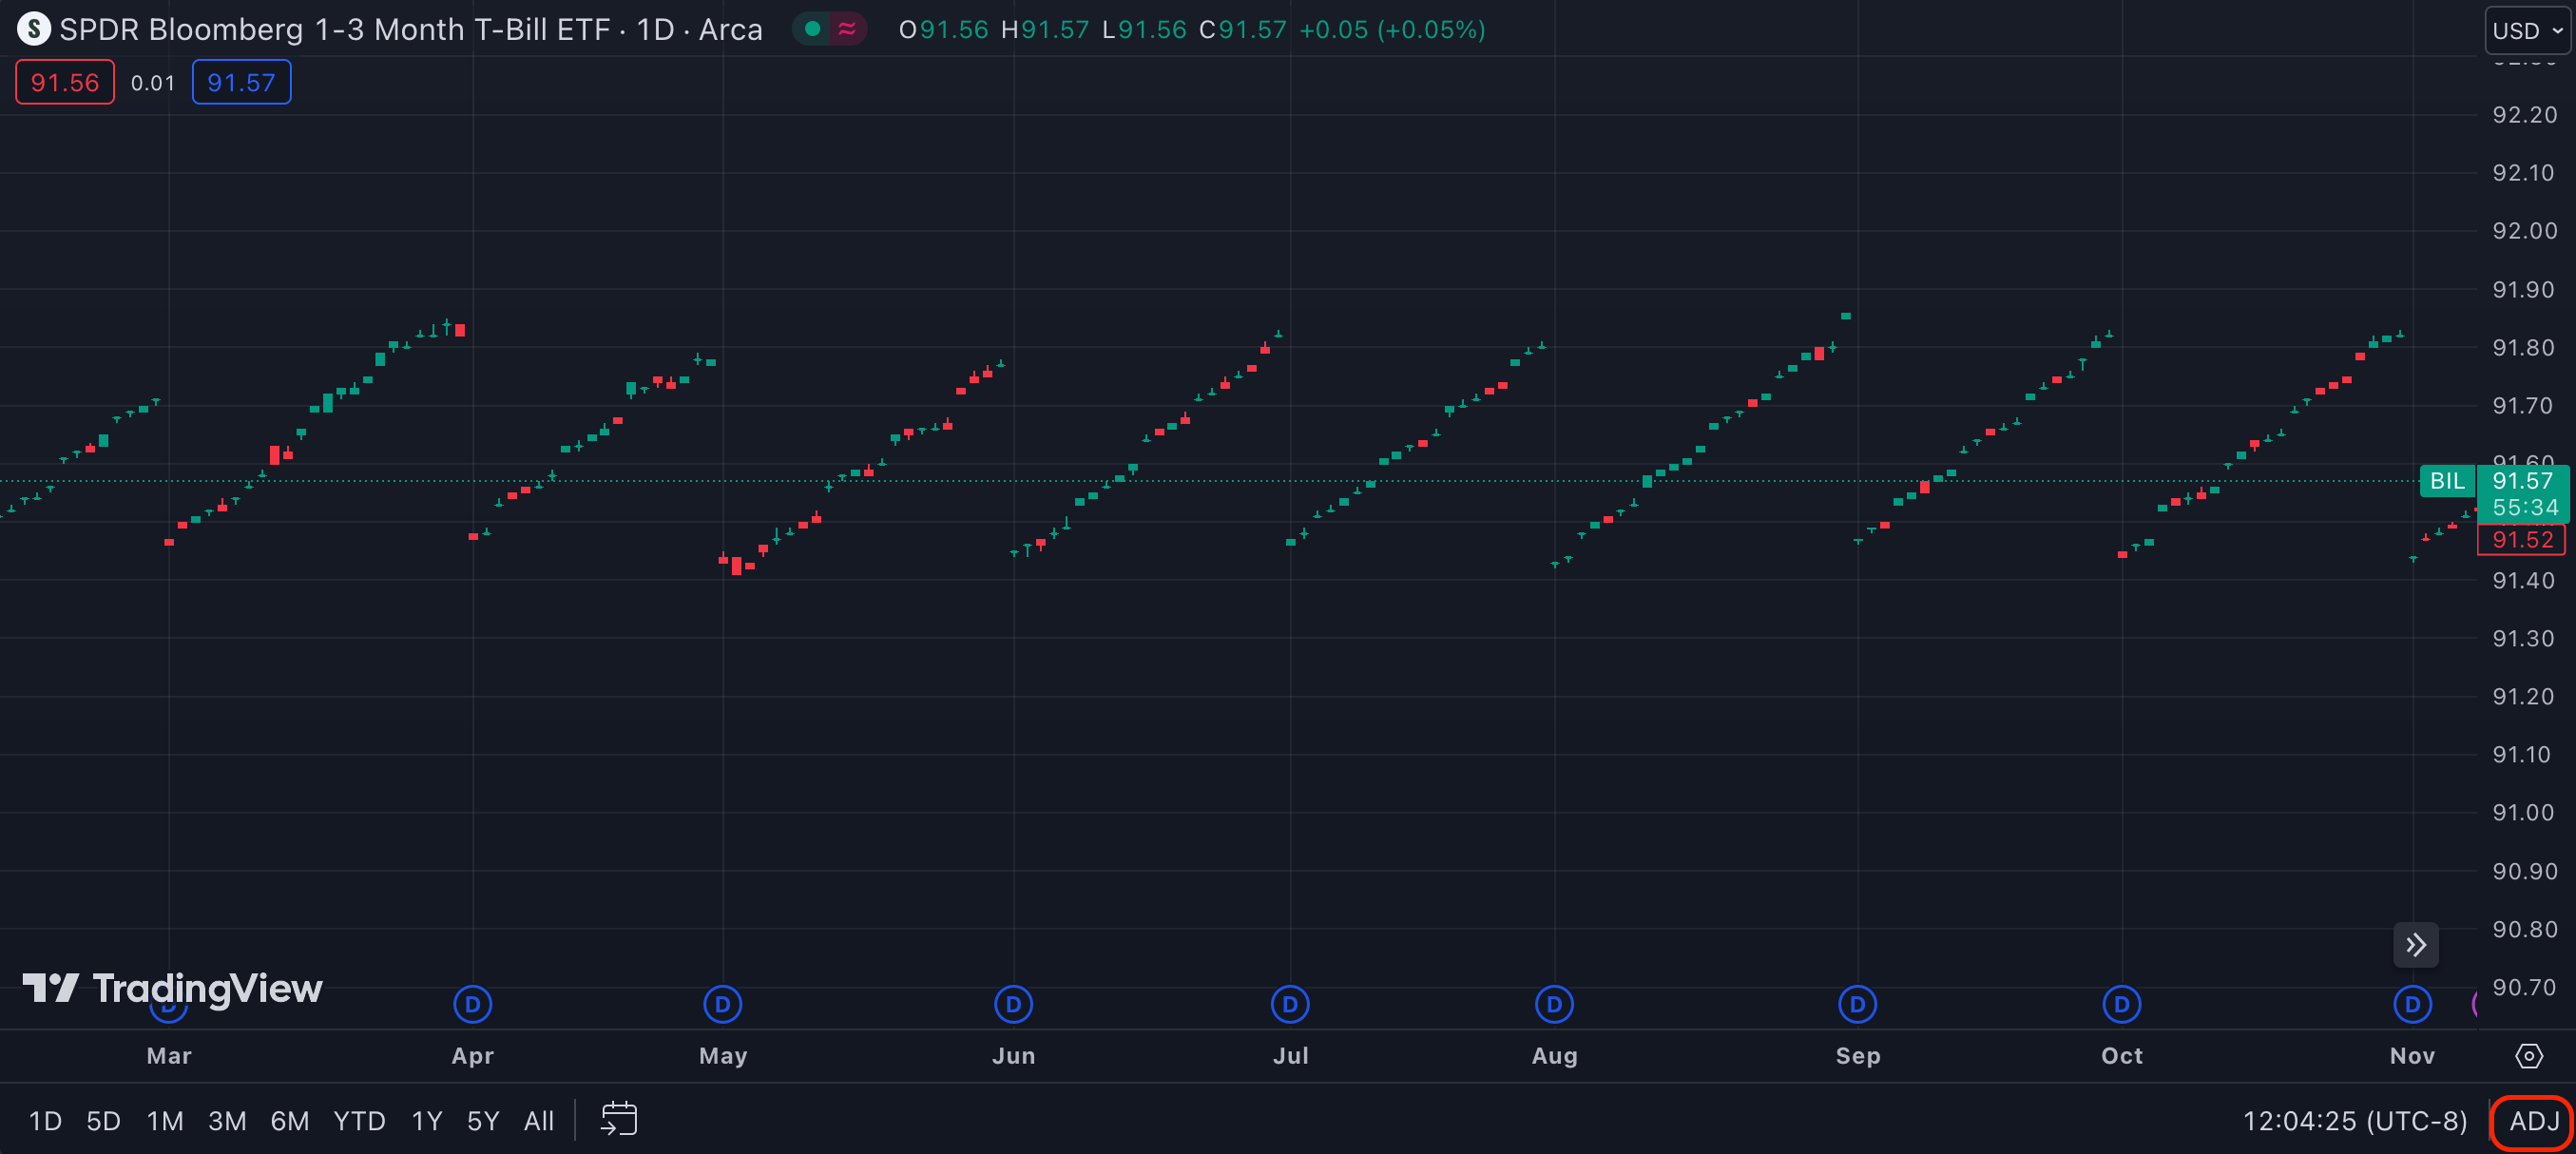
BIL has monthly dividends. As you can see from the state at bottom right corner, the top chart displays adjusted prices. Meanwhile, unadjusted prices at the bottom present a drastically different portrait, crystallizing the importance of the price adjustments.
How should the adjustment be done exactly? It’s a hypothetical calculation, so technically there is no single right answer. However, the Center for Research in Security Prices (CRSP) proposes a widely accepted standard. I couldn’t locate a related resource on its website, but it’s essentially what this post from the NASDAQ website delineates:
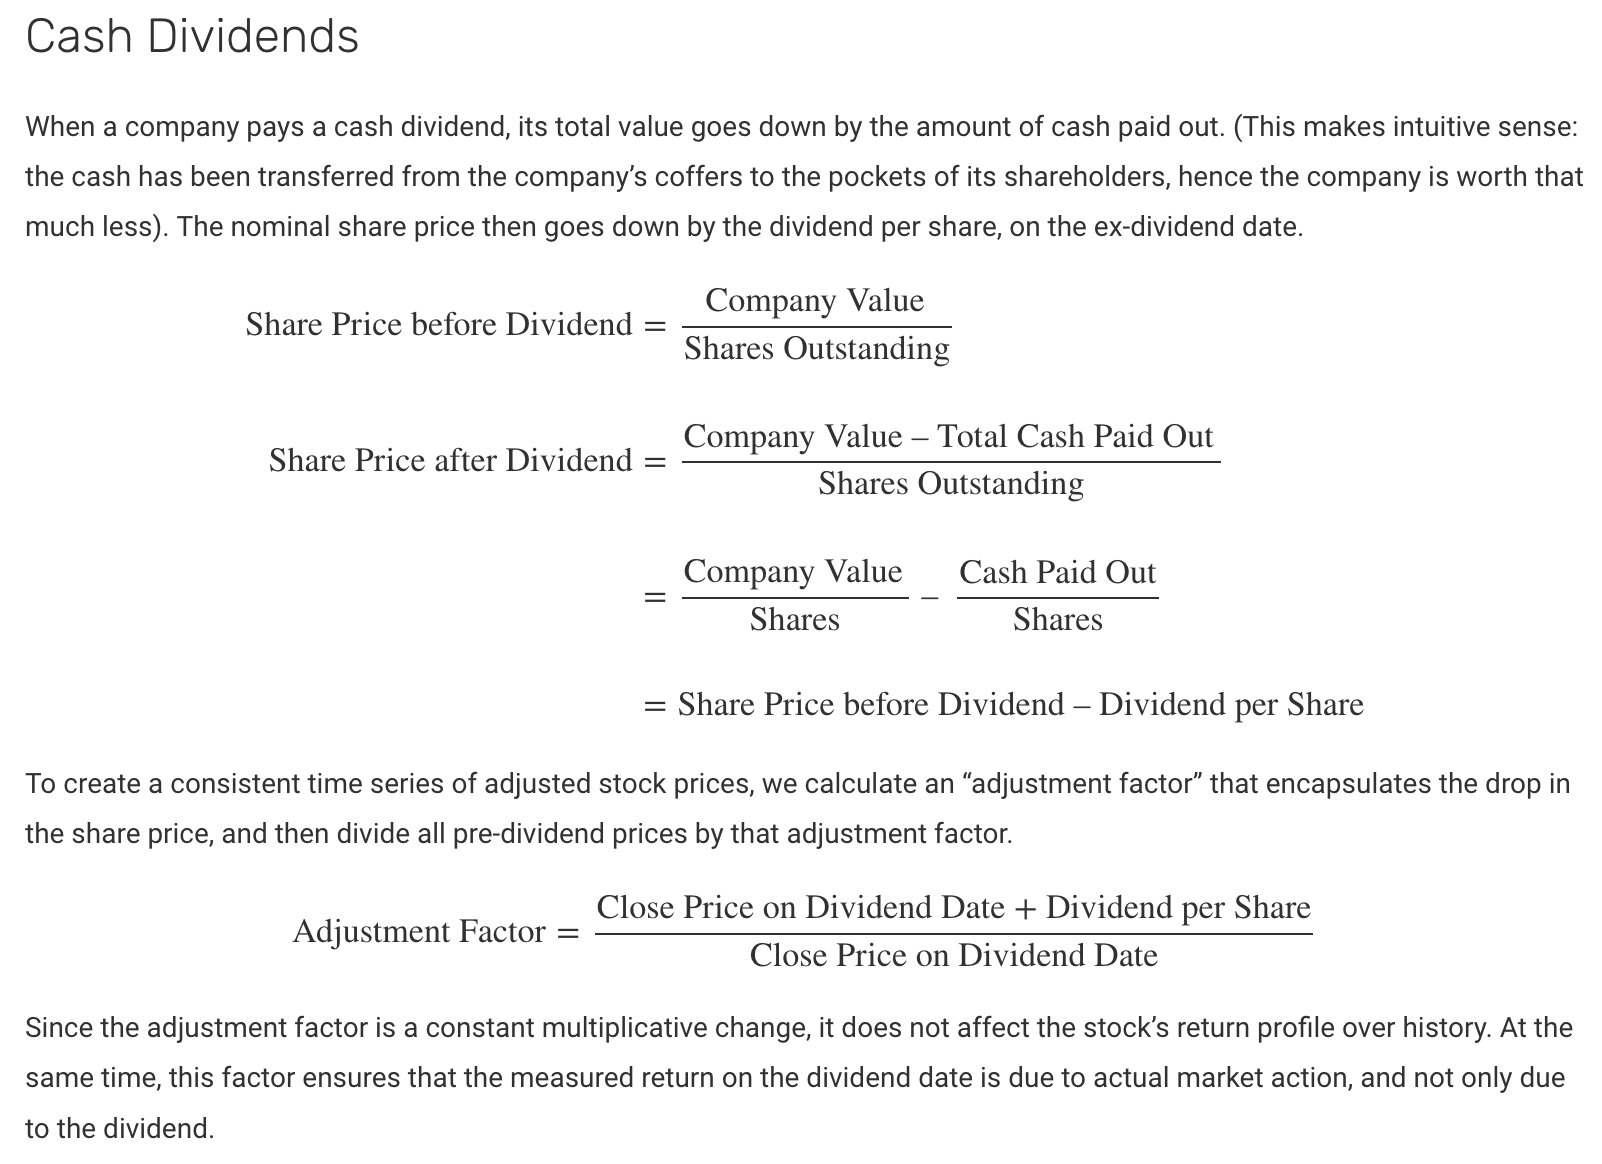
A thing to note here is the fact that an adjustment factor can be known only after the market close on the Ex-Dividend date, which implies that the relevant ticker’s real-time prices during the the market hours of the day won’t be compatible with its historical data as it has yet to be adjusted. What do you do then if you need to evaluate your strategy for the day? A quick solution is to adjust the real-time price instead of the historical data. Merely add the dividend amount to the latest price to achieve compatibility with its historical data for the day’s strategy evaluation.
And how about TradingView? It appears to have opted for a simpler route by not adhering strictly to the CRSP standard. Instead, it sidesteps this issue by utilizing the Close Price on the day before the Dividend Date instead of the Close Price on the Dividend Date for the adjustment factor computation. The assumption here is that dividends are reinvested in the security not on the Ex-Distribution Date but the previous day. Here's how I arrived at this inference:
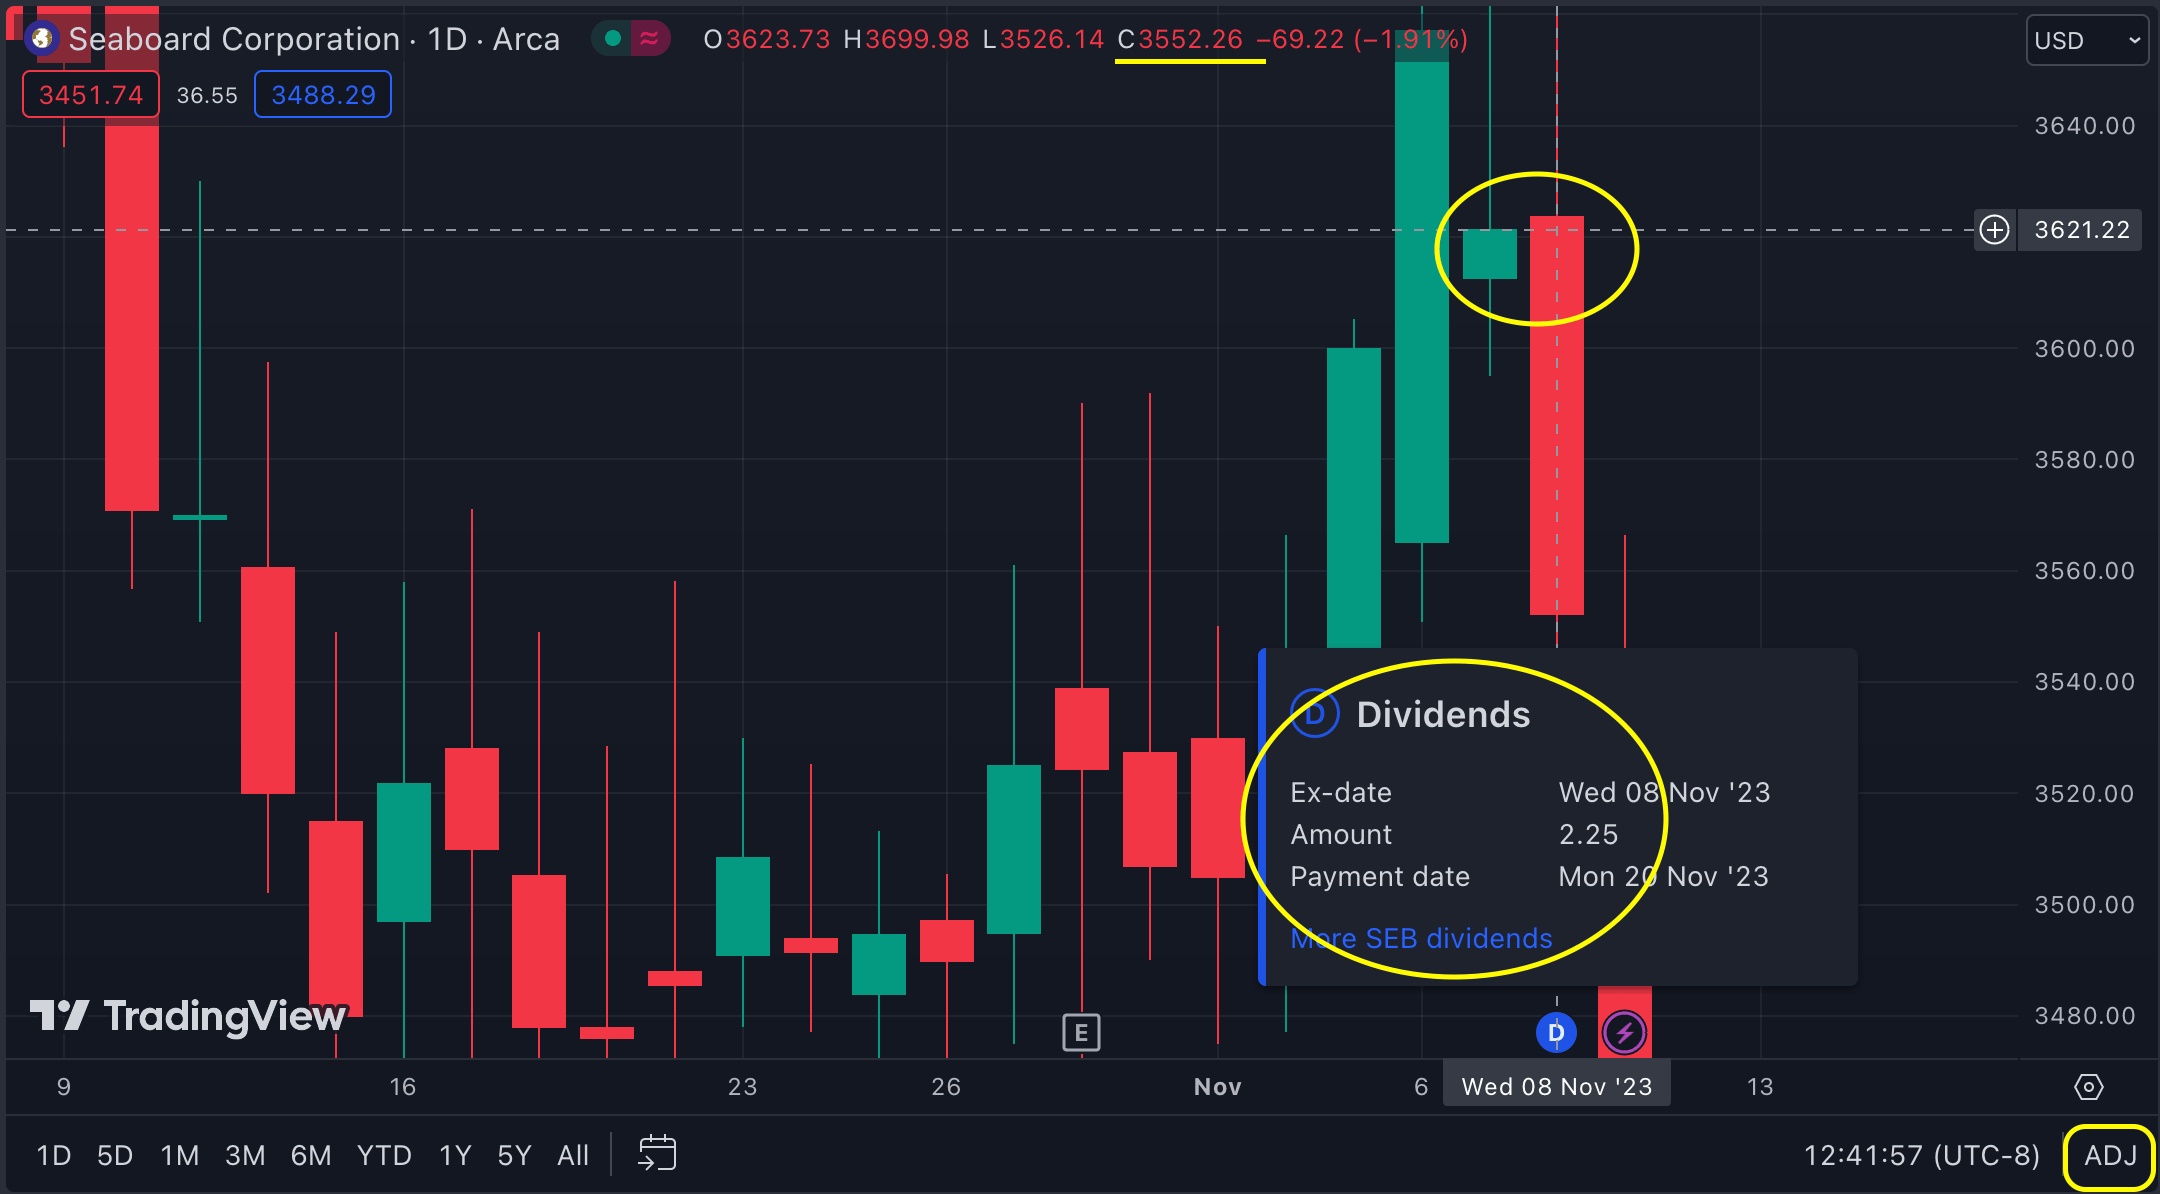
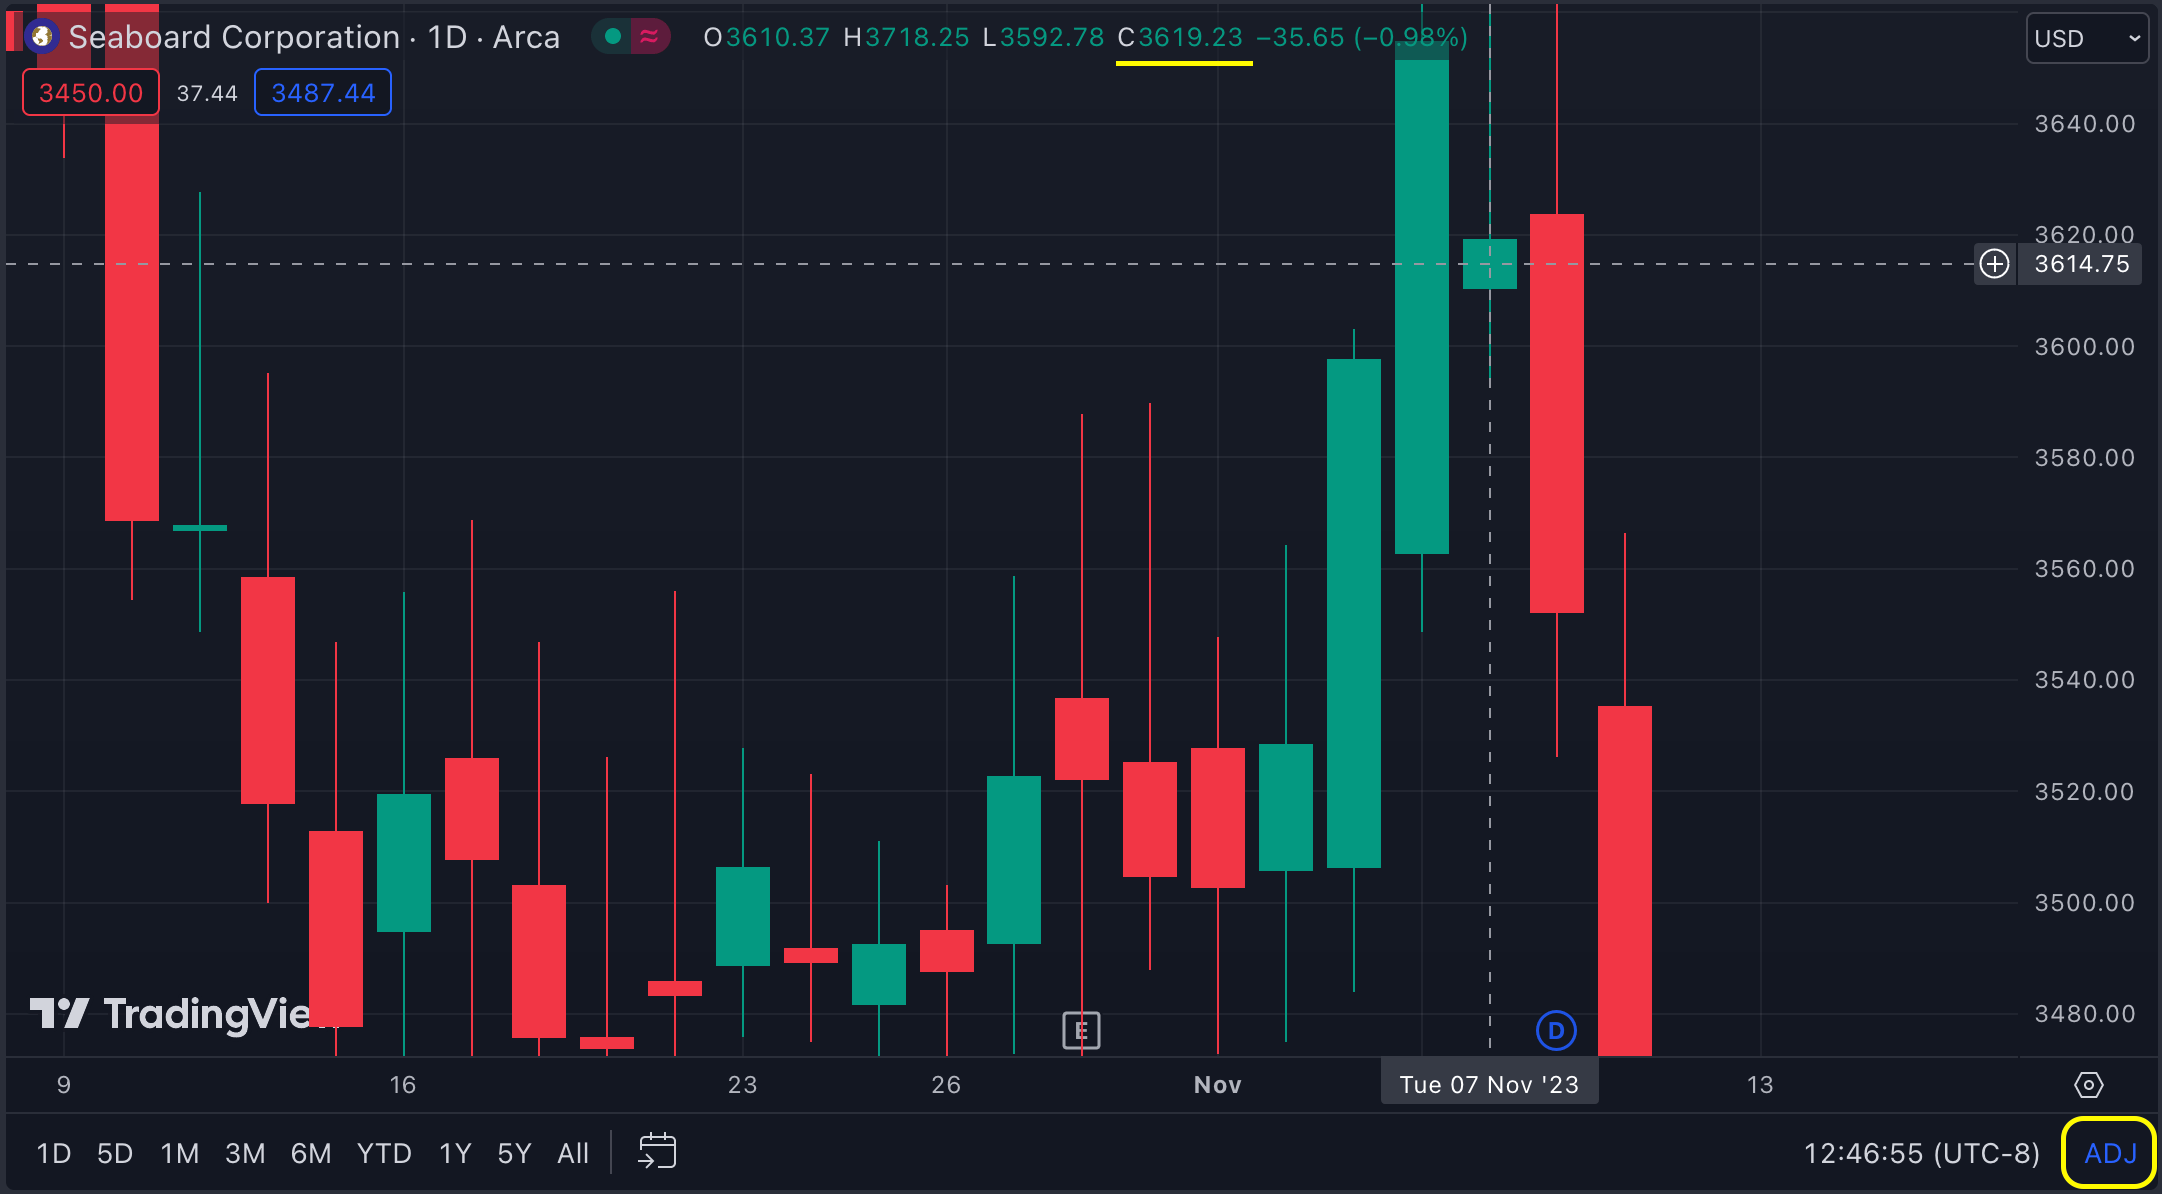
The SEB stock had a cash dividend on 11/8/2023. Its unadjusted close price was 3552.26 on the dividend date and 3621.48 on the day prior. Depending on your method, you might get two different outcomes for the adjusted price of 11/7:
TradingView lists the adjusted price of 3619.23 for 11/7, corroborating my guess:
How to make the adjustment is one question, and another is the time and reliability of the execution. As highlighted in this insightful post, it’s a rarity to find a historical data provider who handles this perfectly. Unfortunately, inaccurate or tardy adjustments are common occurrences, making the life of anyone who desires an accurate backtesting and automated trading tool more difficult.
Hope you’ve learned something interesting or useful here and it has given you an appreciation for the intricacies in reality!