
Taking Advantage of an Indicator's Past Readings
Some Preliminary Ideas to Utilize QuantMage's New Capability

QuantMage’s indicators are evaluated for the current day by default. Until now, there was no way to reference past readings in a condition. This limitation has been lifted with our new feature, opening the door to much more creativity and flexibility in your strategy authoring. Here are some early ideas of mine to put it to good use.

📣 As always, remember that the content here is purely informational. It’s not investment advice or a recommendation to buy or sell any stocks. Always do your own research and consider talking to a financial professional before making any investment moves.
Simple Trend Check
200-day moving average crossovers are often used to check bullish or bearish momentum. The first idea compares today’s 200-day exponential moving average reading against its value 20 days ago. It enters an SPY position if the current reading has been greater for the last 10 days:
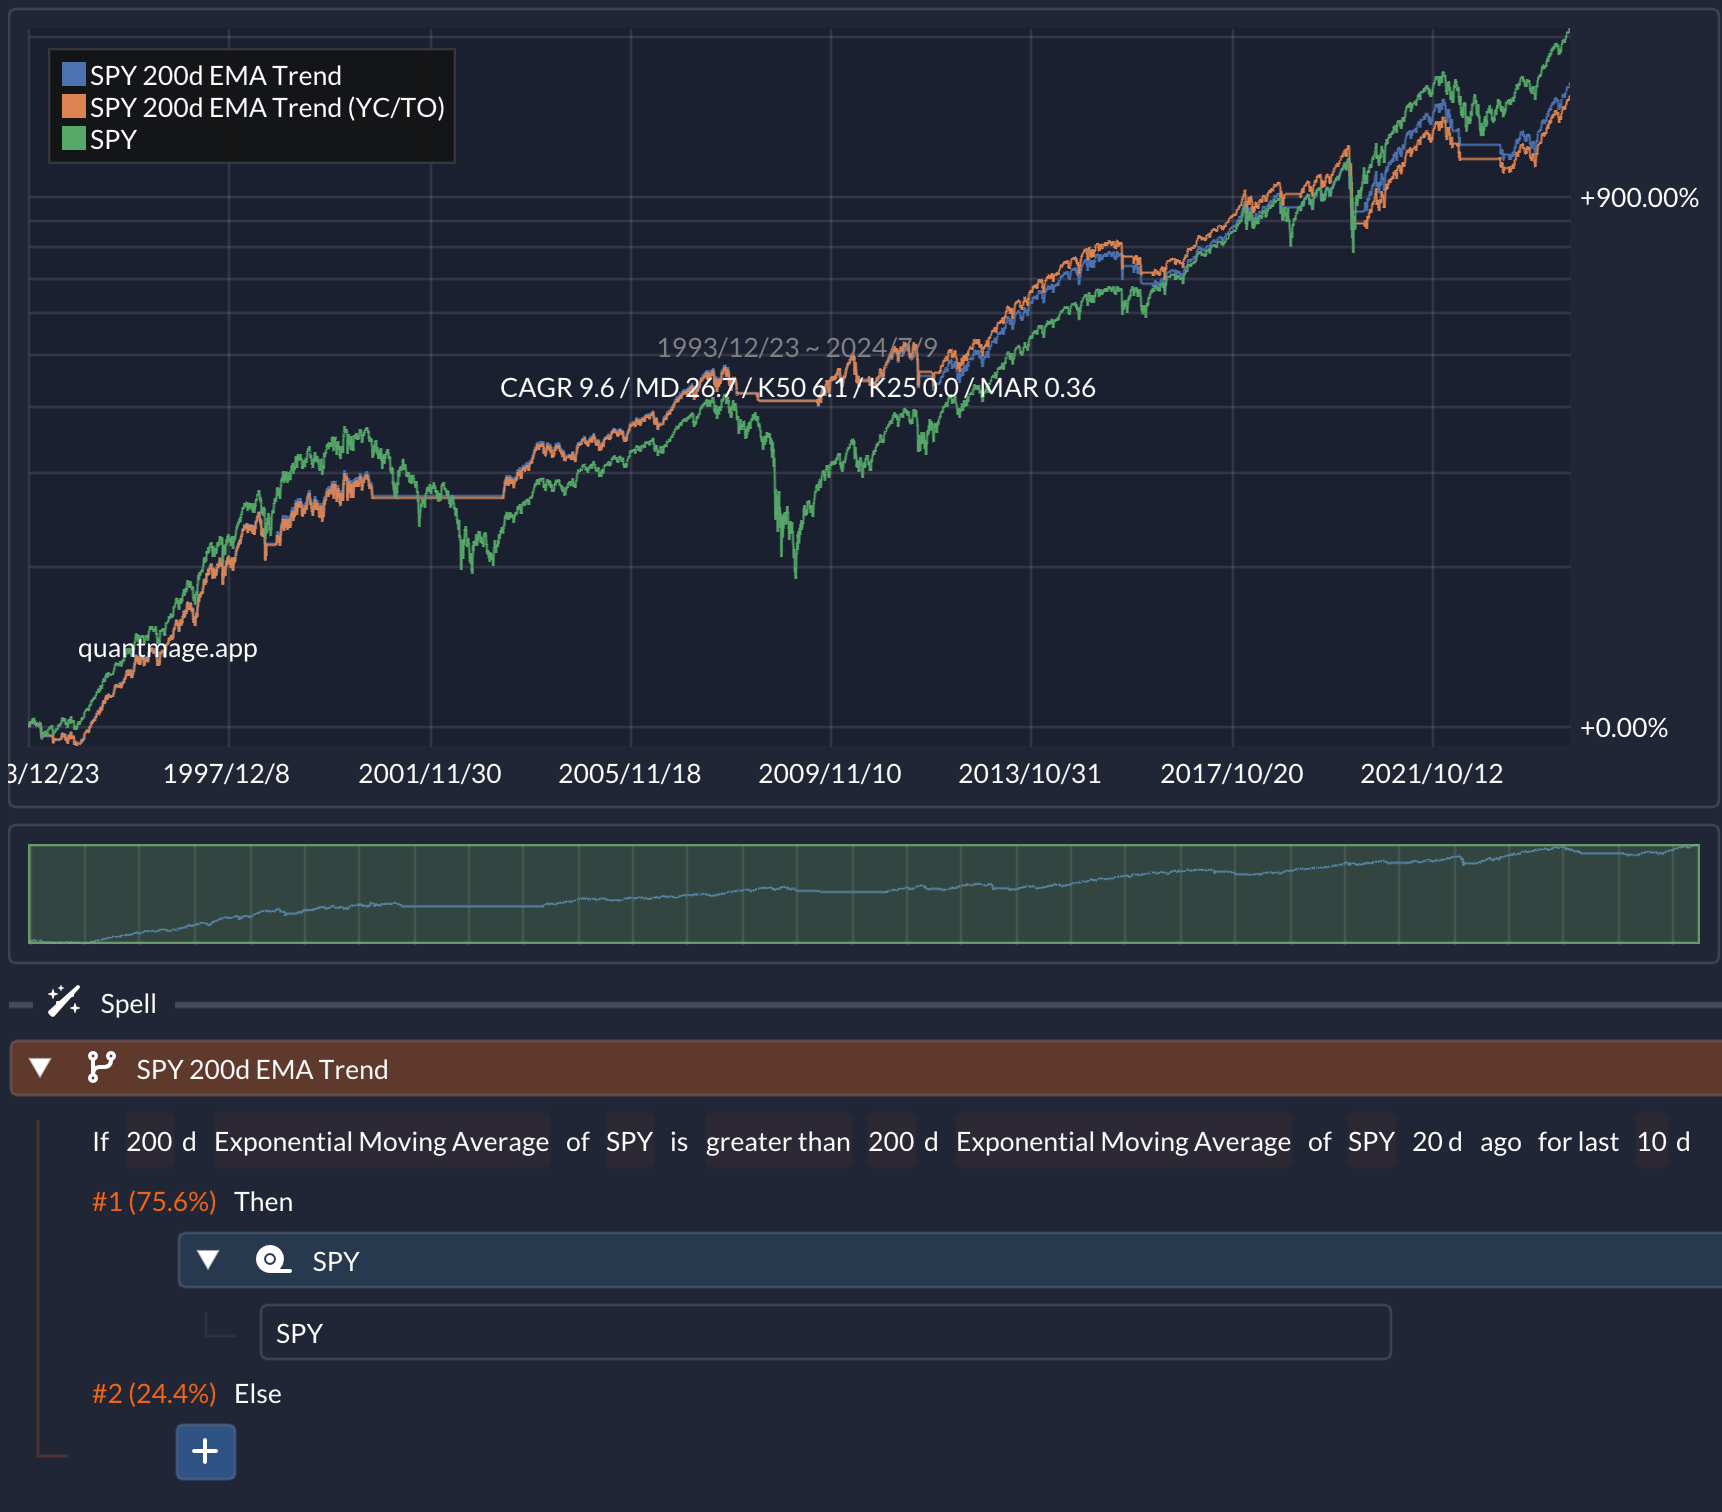
Its 30-year CAGR is slightly lower than the SPY buy-and-hold, but it shows a much better risk-adjusted return. It weathered tough periods like the 2000 dot-com crash, 2008 financial crisis, and 2020 COVID crash much more fluidly. Explore it yourself here and also compare it against a moving average crossover strategy.
Tops & Bottoms
Some argue that detecting the tops and bottoms of a moving average curve is better than using its crossovers. Here, I use 200-day moving averages and check the point where it bounces from its local bottom. It exits the position as soon as the moving average starts its downtrend. Distinct entry and exit conditions are enabled by QuantMage’s Enter/Exit incantation:
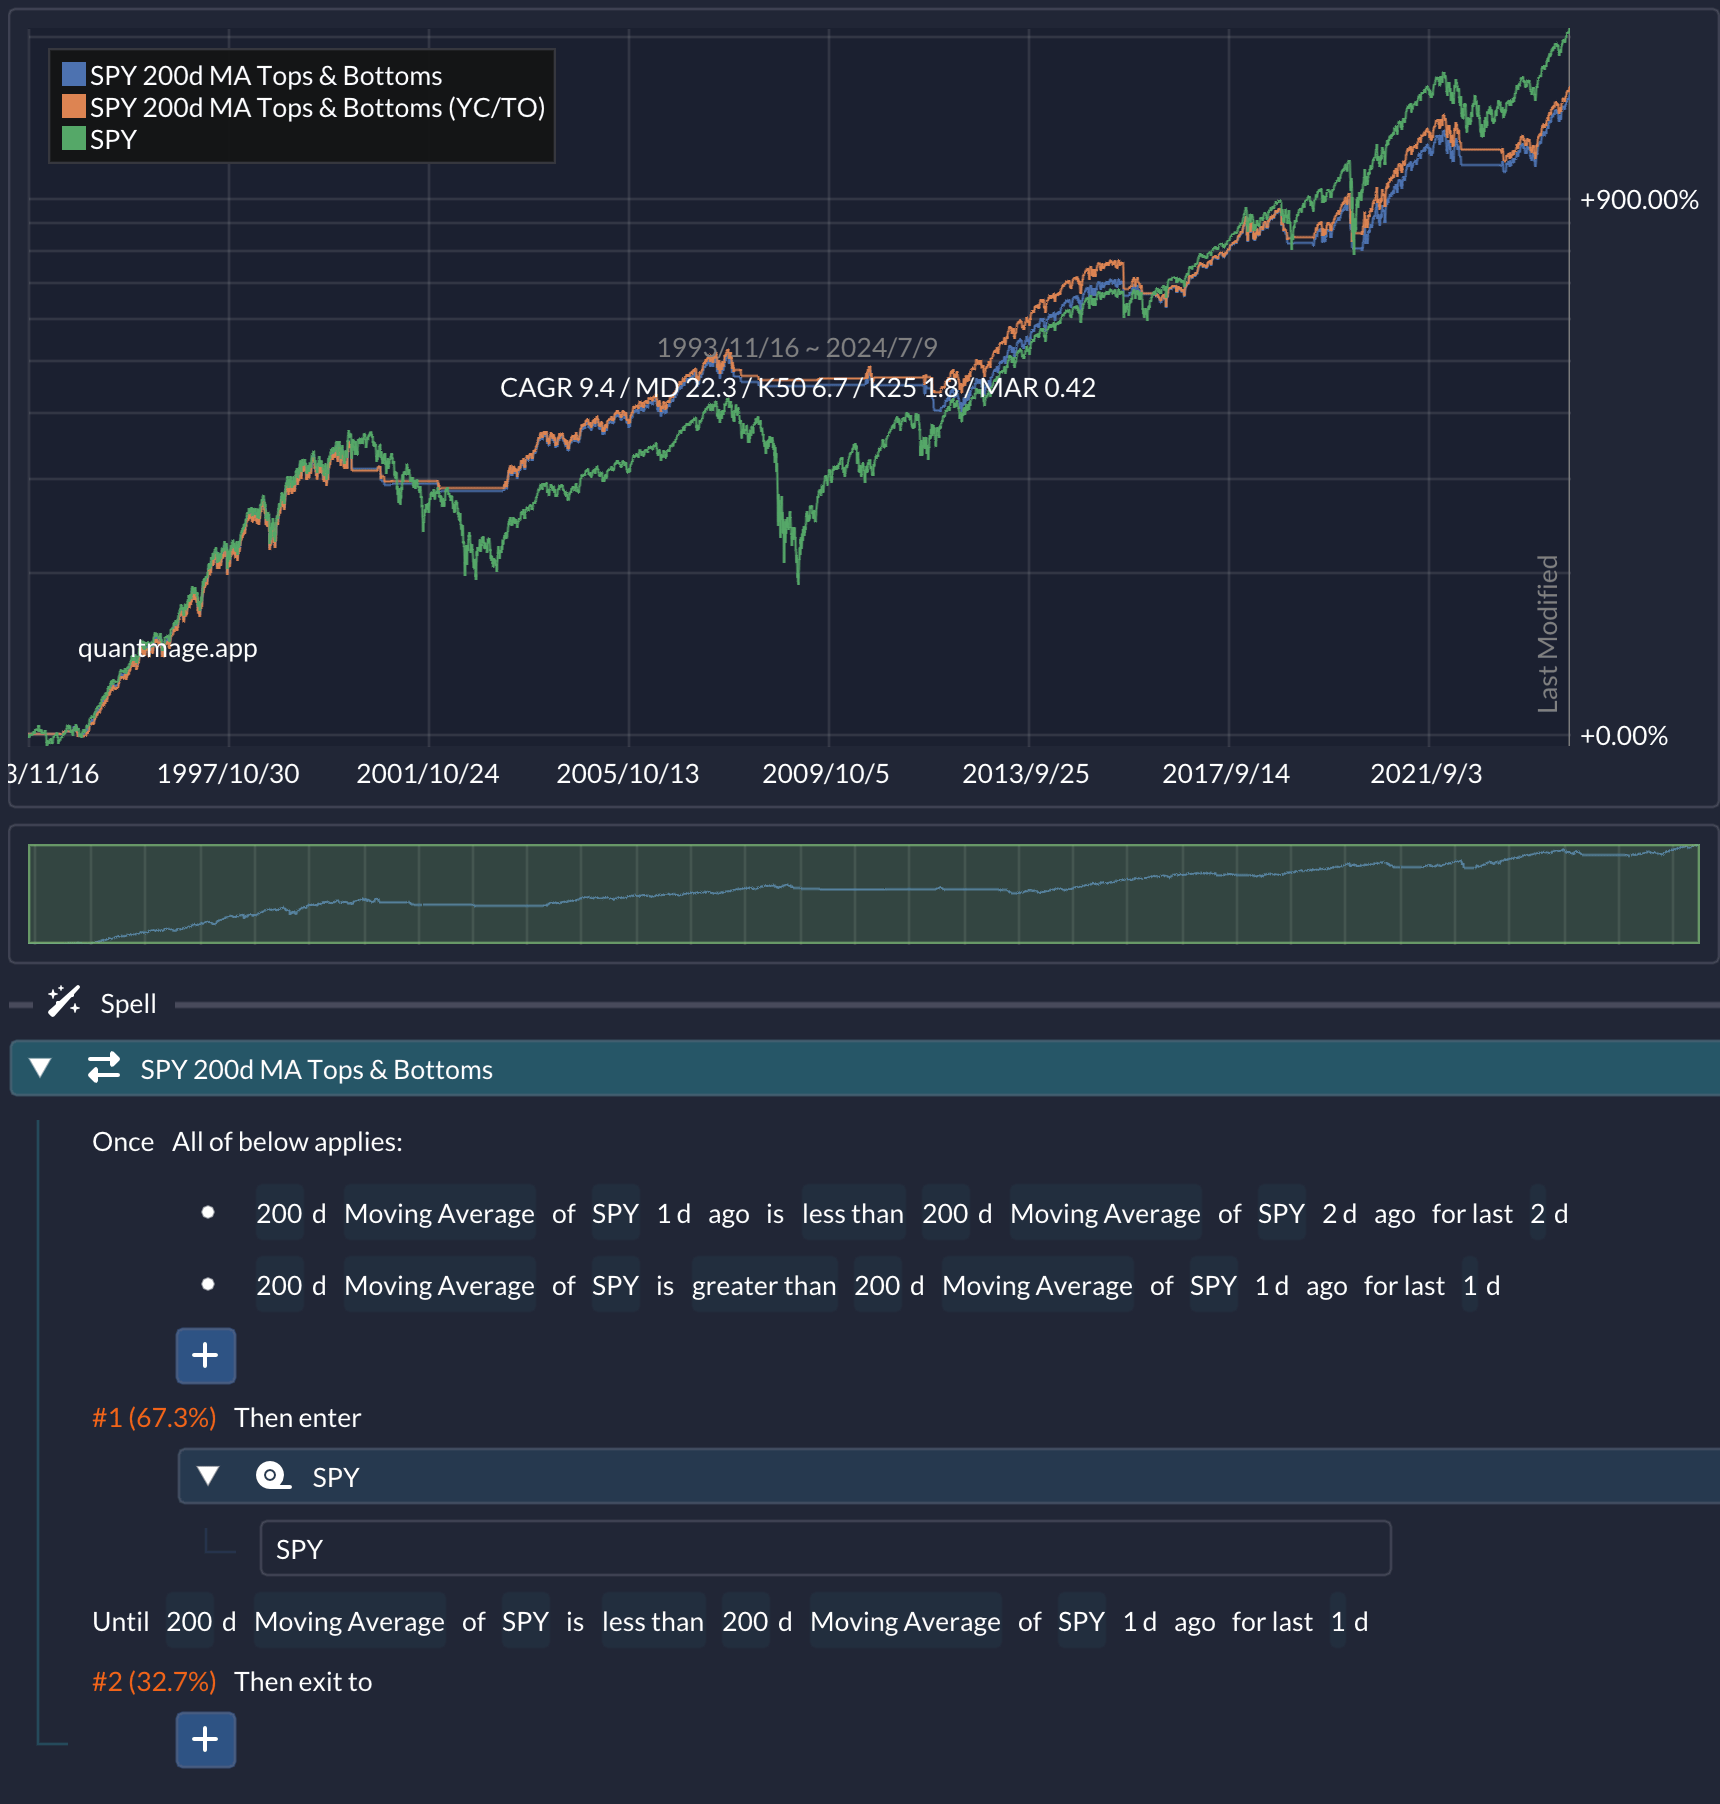
It also shows a decent risk-adjusted return. Check it out here.
Slope Check
This idea checks price changes over certain periods to determine entry or exit. Basically, it’s like checking how steep the approximate slope of the price curve is. QuantMage’s weight & bias feature is used to enable this. It enters SPY if its current price is higher than its price 15 days ago by at least 0.5. It exits the position if its current price is lower than its price 200 days ago by at least 5. The entry condition should hold for 10 consecutive days:
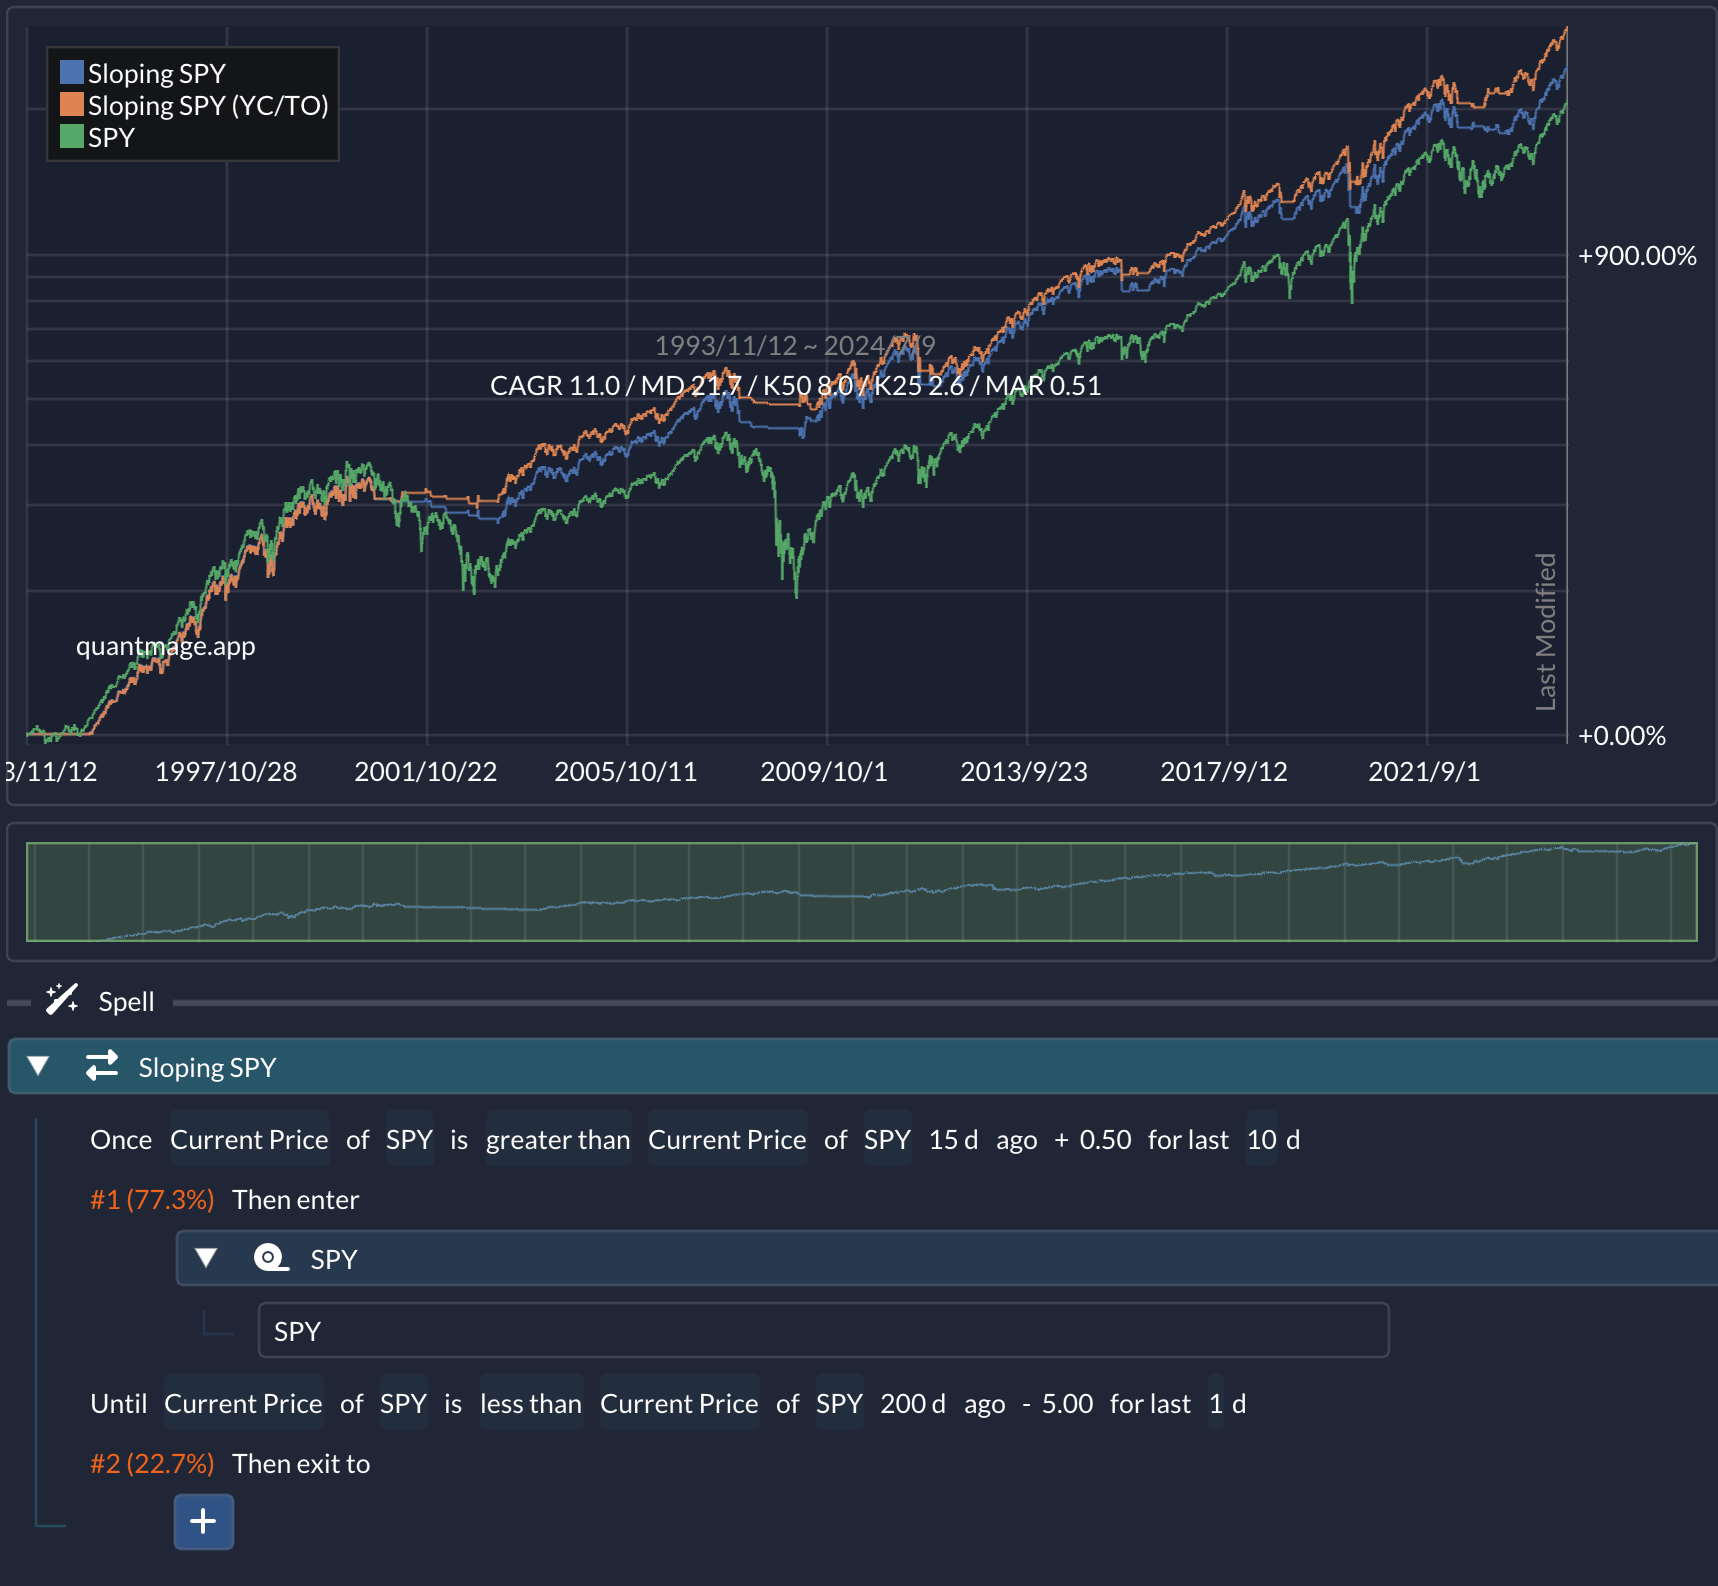
It achieves the best risk-adjusted return so far. I’ll take it with a grain of salt, though, due to the high chance of overfitting given the several tunable parameters involved. Take a look at it here.
RSI Divergences
The last idea uses RSI divergences as entry/exit signals. RSI divergences mean that a price trend and the trend of its RSI tell different stories. It enters SVXY (a short volatility ETF) when SPY’s price has gone down over the last 20 days while its 5-day RSI has risen over the same period (a bullish divergence). It exits the position when the opposite, a bearish divergence, happens. Either condition should hold for 5 consecutive days before a trade is triggered:
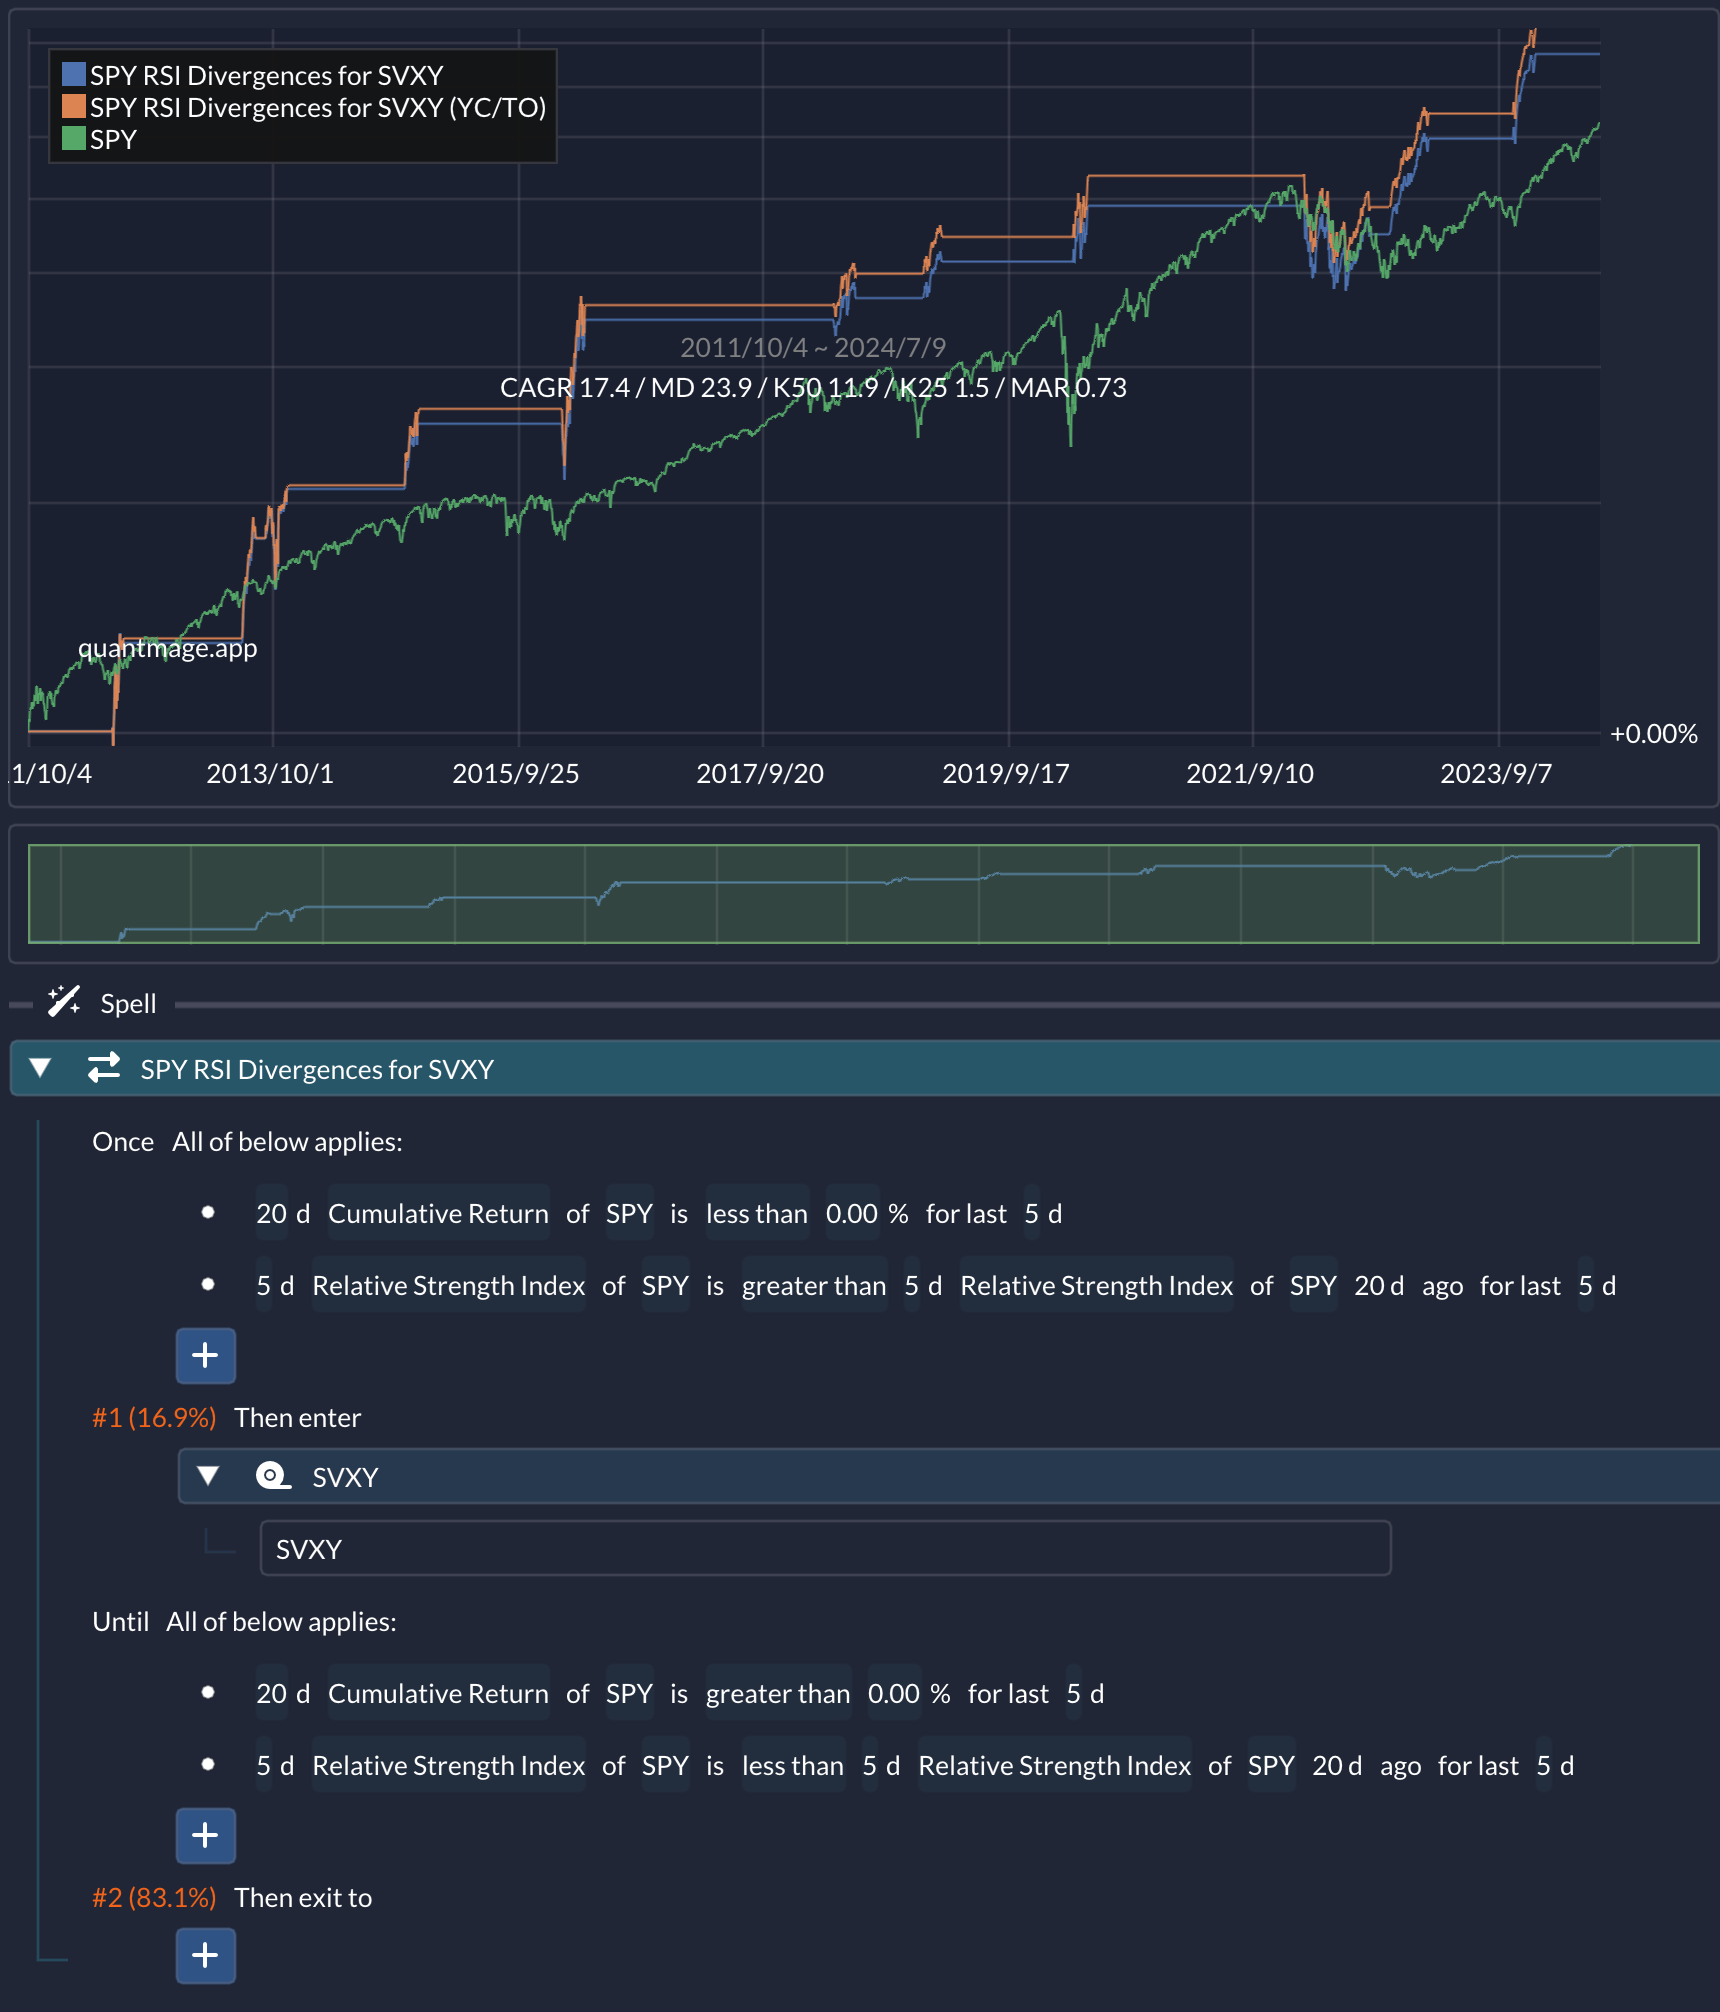
For a 13-year period, it pulls off an impressive annual return of 17.4% by being in the market only 16.9% of the time! You might ask why we’re using SVXY instead of SPY (or any other risk-on assets for that matter). The answer is I didn’t find any other assets that give me a decent result when used in place of SVXY. 😅 Give the strategy a try here.
Share Your Ideas!
I’m sure I just scratched the surface of the possibility space this new feature enables. Does any idea pop up in your head hearing about the new tool? Do you happen to know any articles or papers that discuss strategies requiring this capability? Please share them in the comments below! 💬📝👇