
RSI-based Mean Reversion
Capitalizing on Market Extremes with RSI

Hello, fellow investors!
In this edition, we're diving into a fascinating RSI-based mean reversion strategy. Relative Strength Index, as you might know, is a nifty tool that tracks momentum by measuring the speed of price movements. When it goes above 70%, the market might be overbought; below 30%, possibly oversold. These signals can be goldmines for short-term profits if the market swings back to the mean.
As usual, the content here is purely informational. It’s not investment advice, nor a recommendation to buy or sell any stocks. Always do your own research and consider chatting with a financial pro before making any investment moves.
Overbought / Oversold Pops
In the first approach, I used QuantMage’s Enter/Exit incantation to snag these potential short-term movements. It allows separate entry / exit signals, which can be advantageous for reliably capturing the short-term mean reversions. For overbought (sell-the-rip) scenarios, we short the market when RSI peaks over 80% and exit below 75%. I've opted for VIXY (VIX short-term futures ETF) for this part, as it often moves inversely to the market. For oversold (buy-the-dip) cases, we go long with SPXL (3x levered S&P 500 ETF), switching to a cash-like position with BIL when both signals are off:
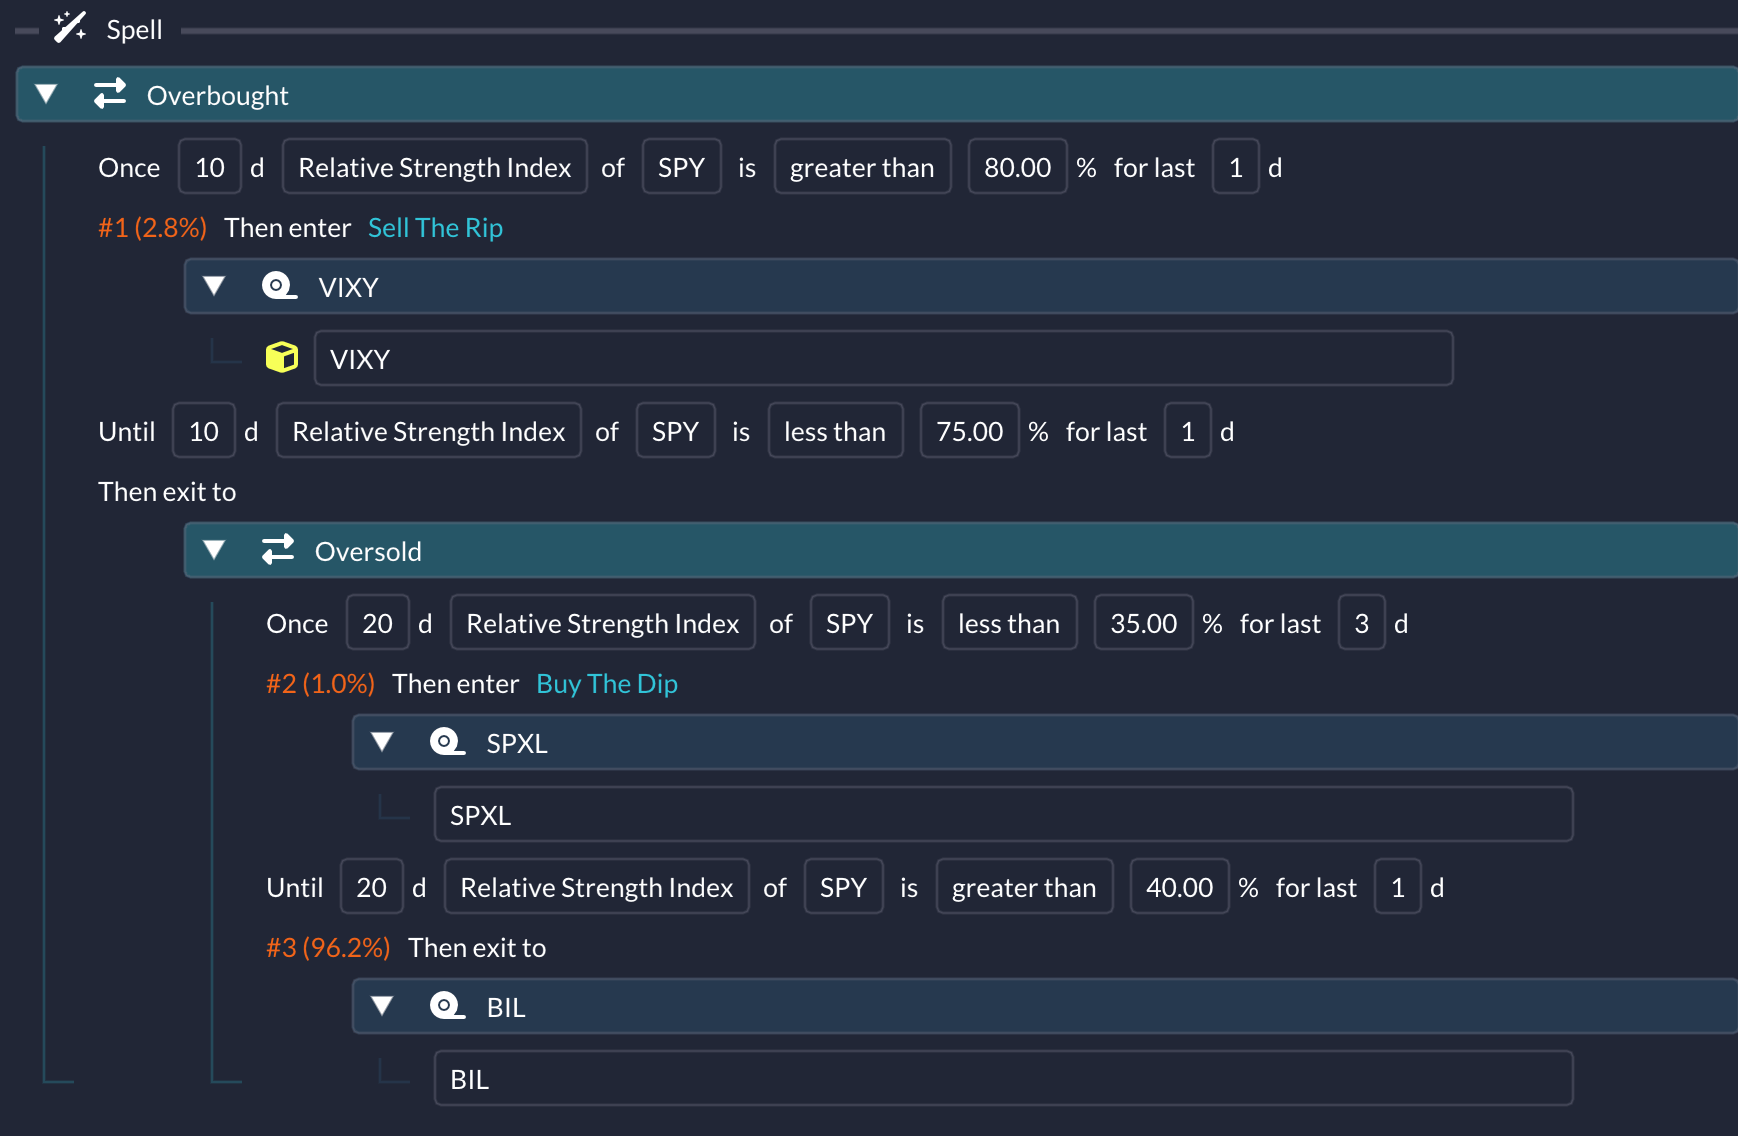
A few things to note: It uses SPY’s RSIs: 10-day for sell-the-rip and 20-day for buy-the-dip. I tried SPXS, 3x levered S&P 500 short ETF, in lieu of VIXY, but the latter produced a better result. In addition, checking the entry signal for 3 consecutive days improved the result for the buy-the-dip. So How does this perform in backtesting?
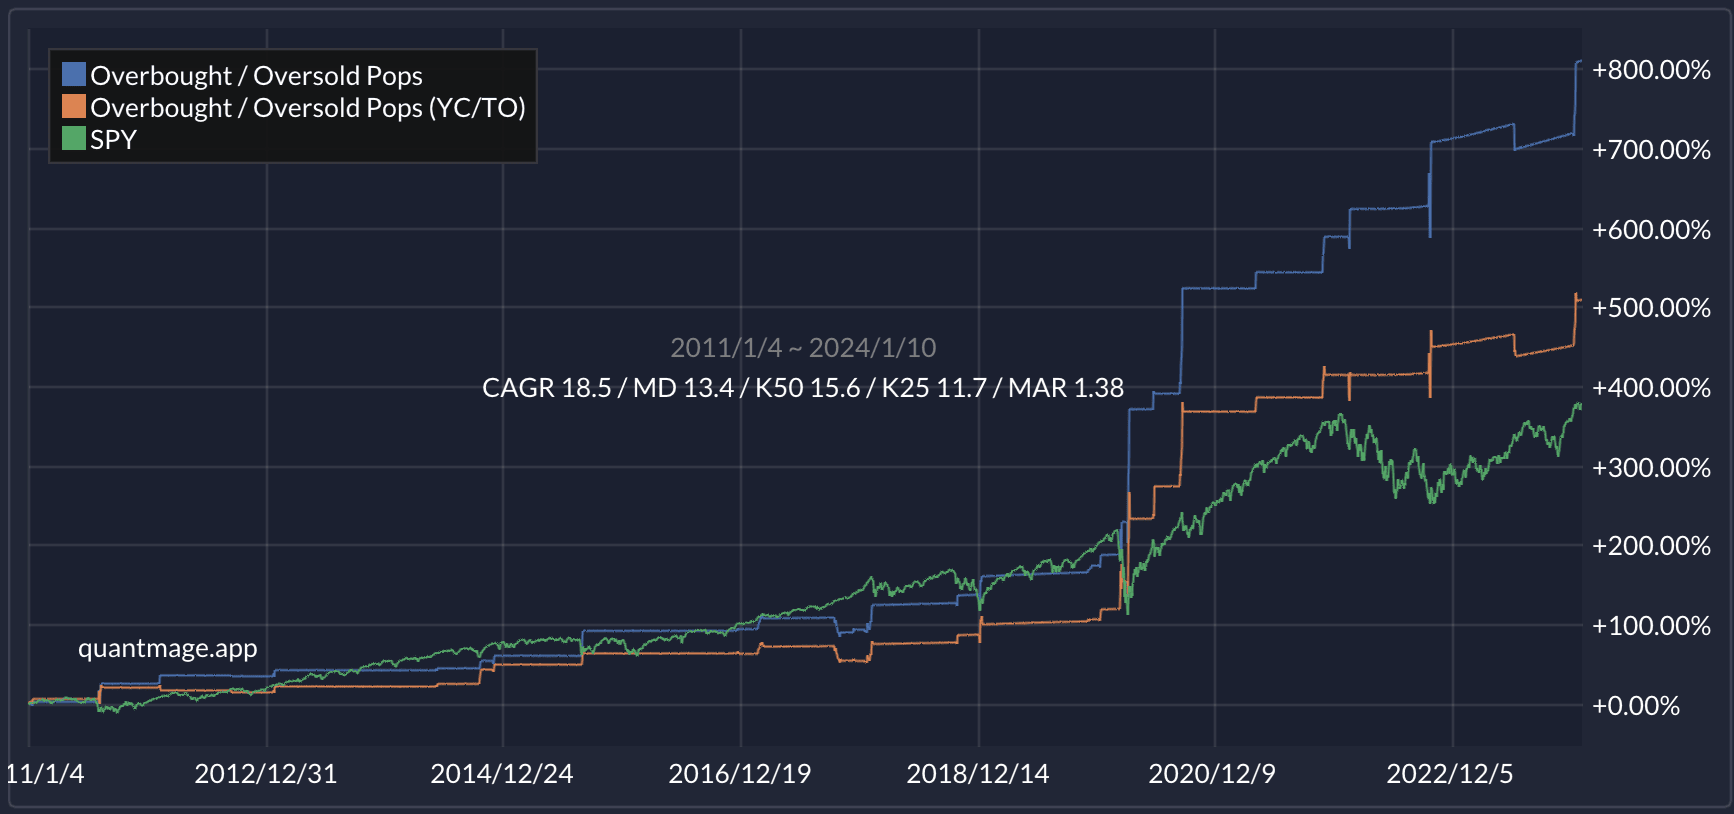
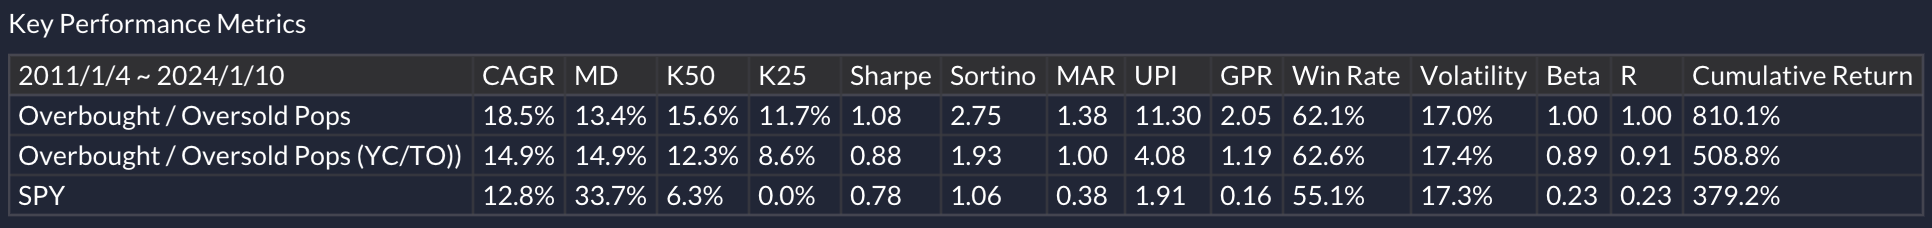
Its 13-year backtest shows an annualized return of 18.5% and a max drawdown of 13.4%. The plot clearly shows that it occasionally pops while being mostly flat otherwise. From an orange text of the spell logic screenshot above, you can see it was indeed in BIL 96.2% of the time. Not a bad result given that it was in the market only 3.8% of the time! Another thing worth noting is the YC/TO plot. YC/TO is short for evaluating the spell using Yesterday’s Close prices and investing with Today’s Open Prices in contrast to the canonical way of evaluating & trading at the same time with each day’s close prices. It’s one way QuantMage shows a spell’s timing sensitivity. As you can see, this spell is quite sensitive and results in a noticeably worse performance (CAGR 14.9% / MD 14.9%) when using the YC/TO approach. So take the historical performance with a grain of salt.
You can see & experiment with it yourself here.
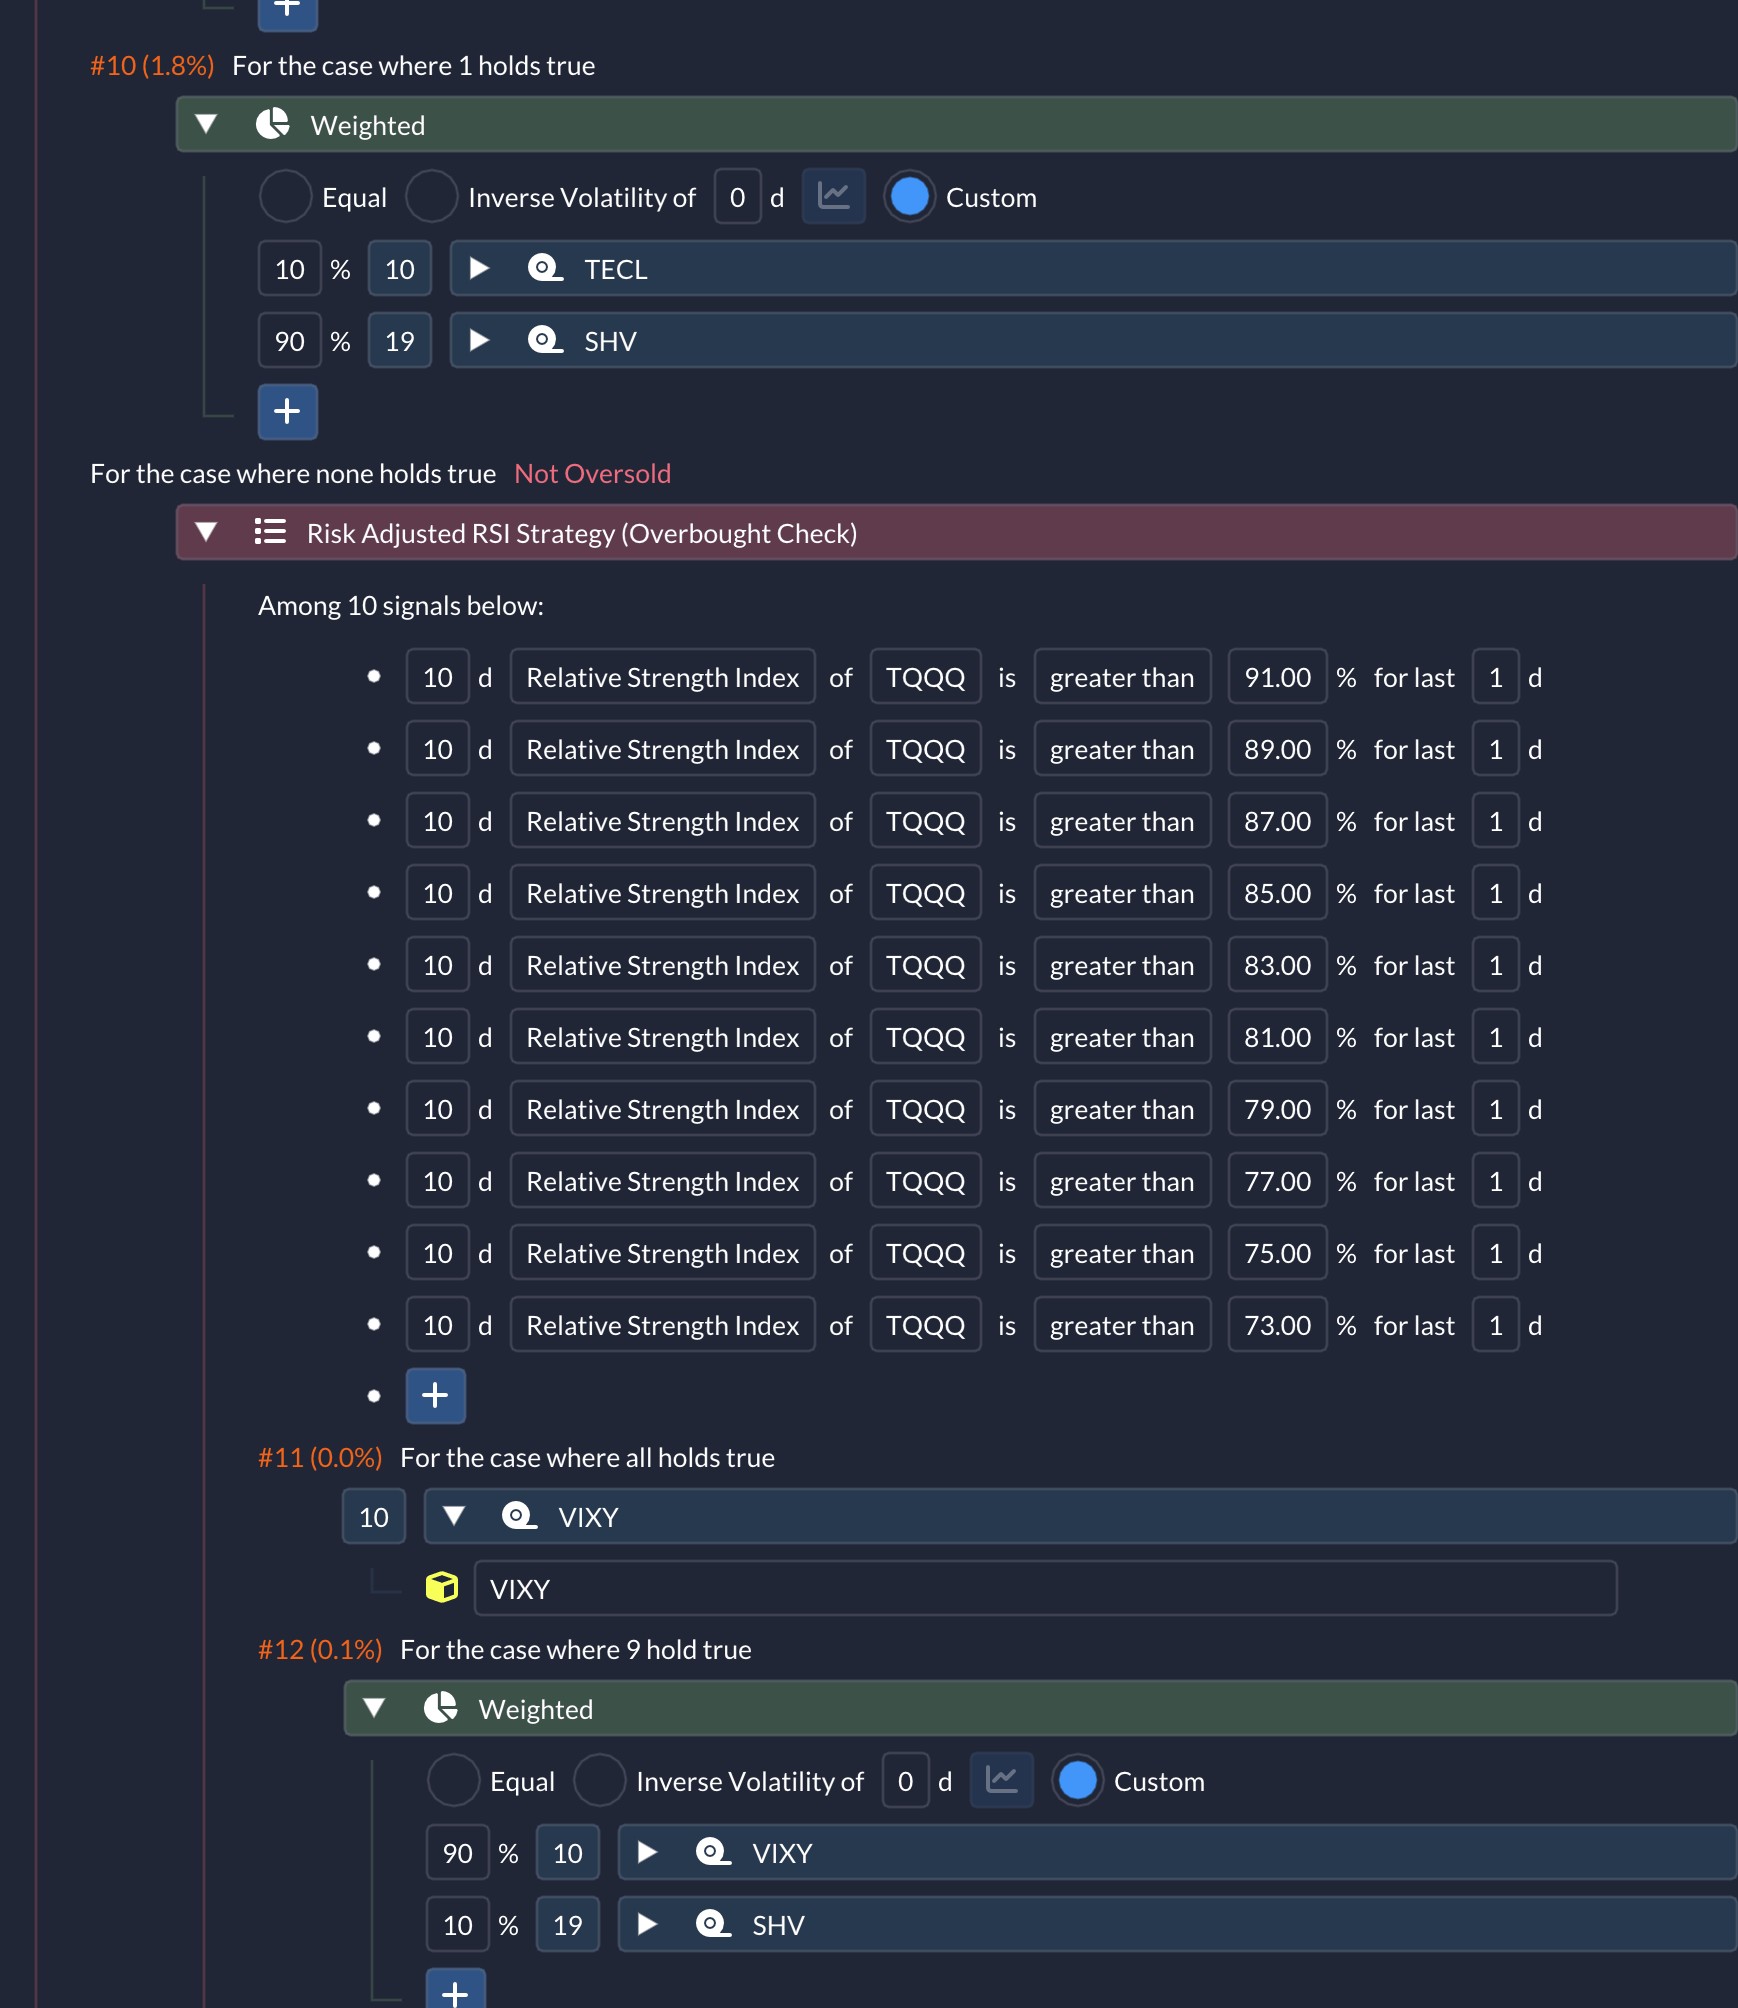
Risk Adjusted Approach
Ever thought of scaling your investment based on how strong the RSI signal is? That's what we're doing in our next approach. By using QuantMage’s Switch incantation, we're playing with different RSI thresholds and adjusting our position in a long/short ETF and a short-term bond ETF accordingly:
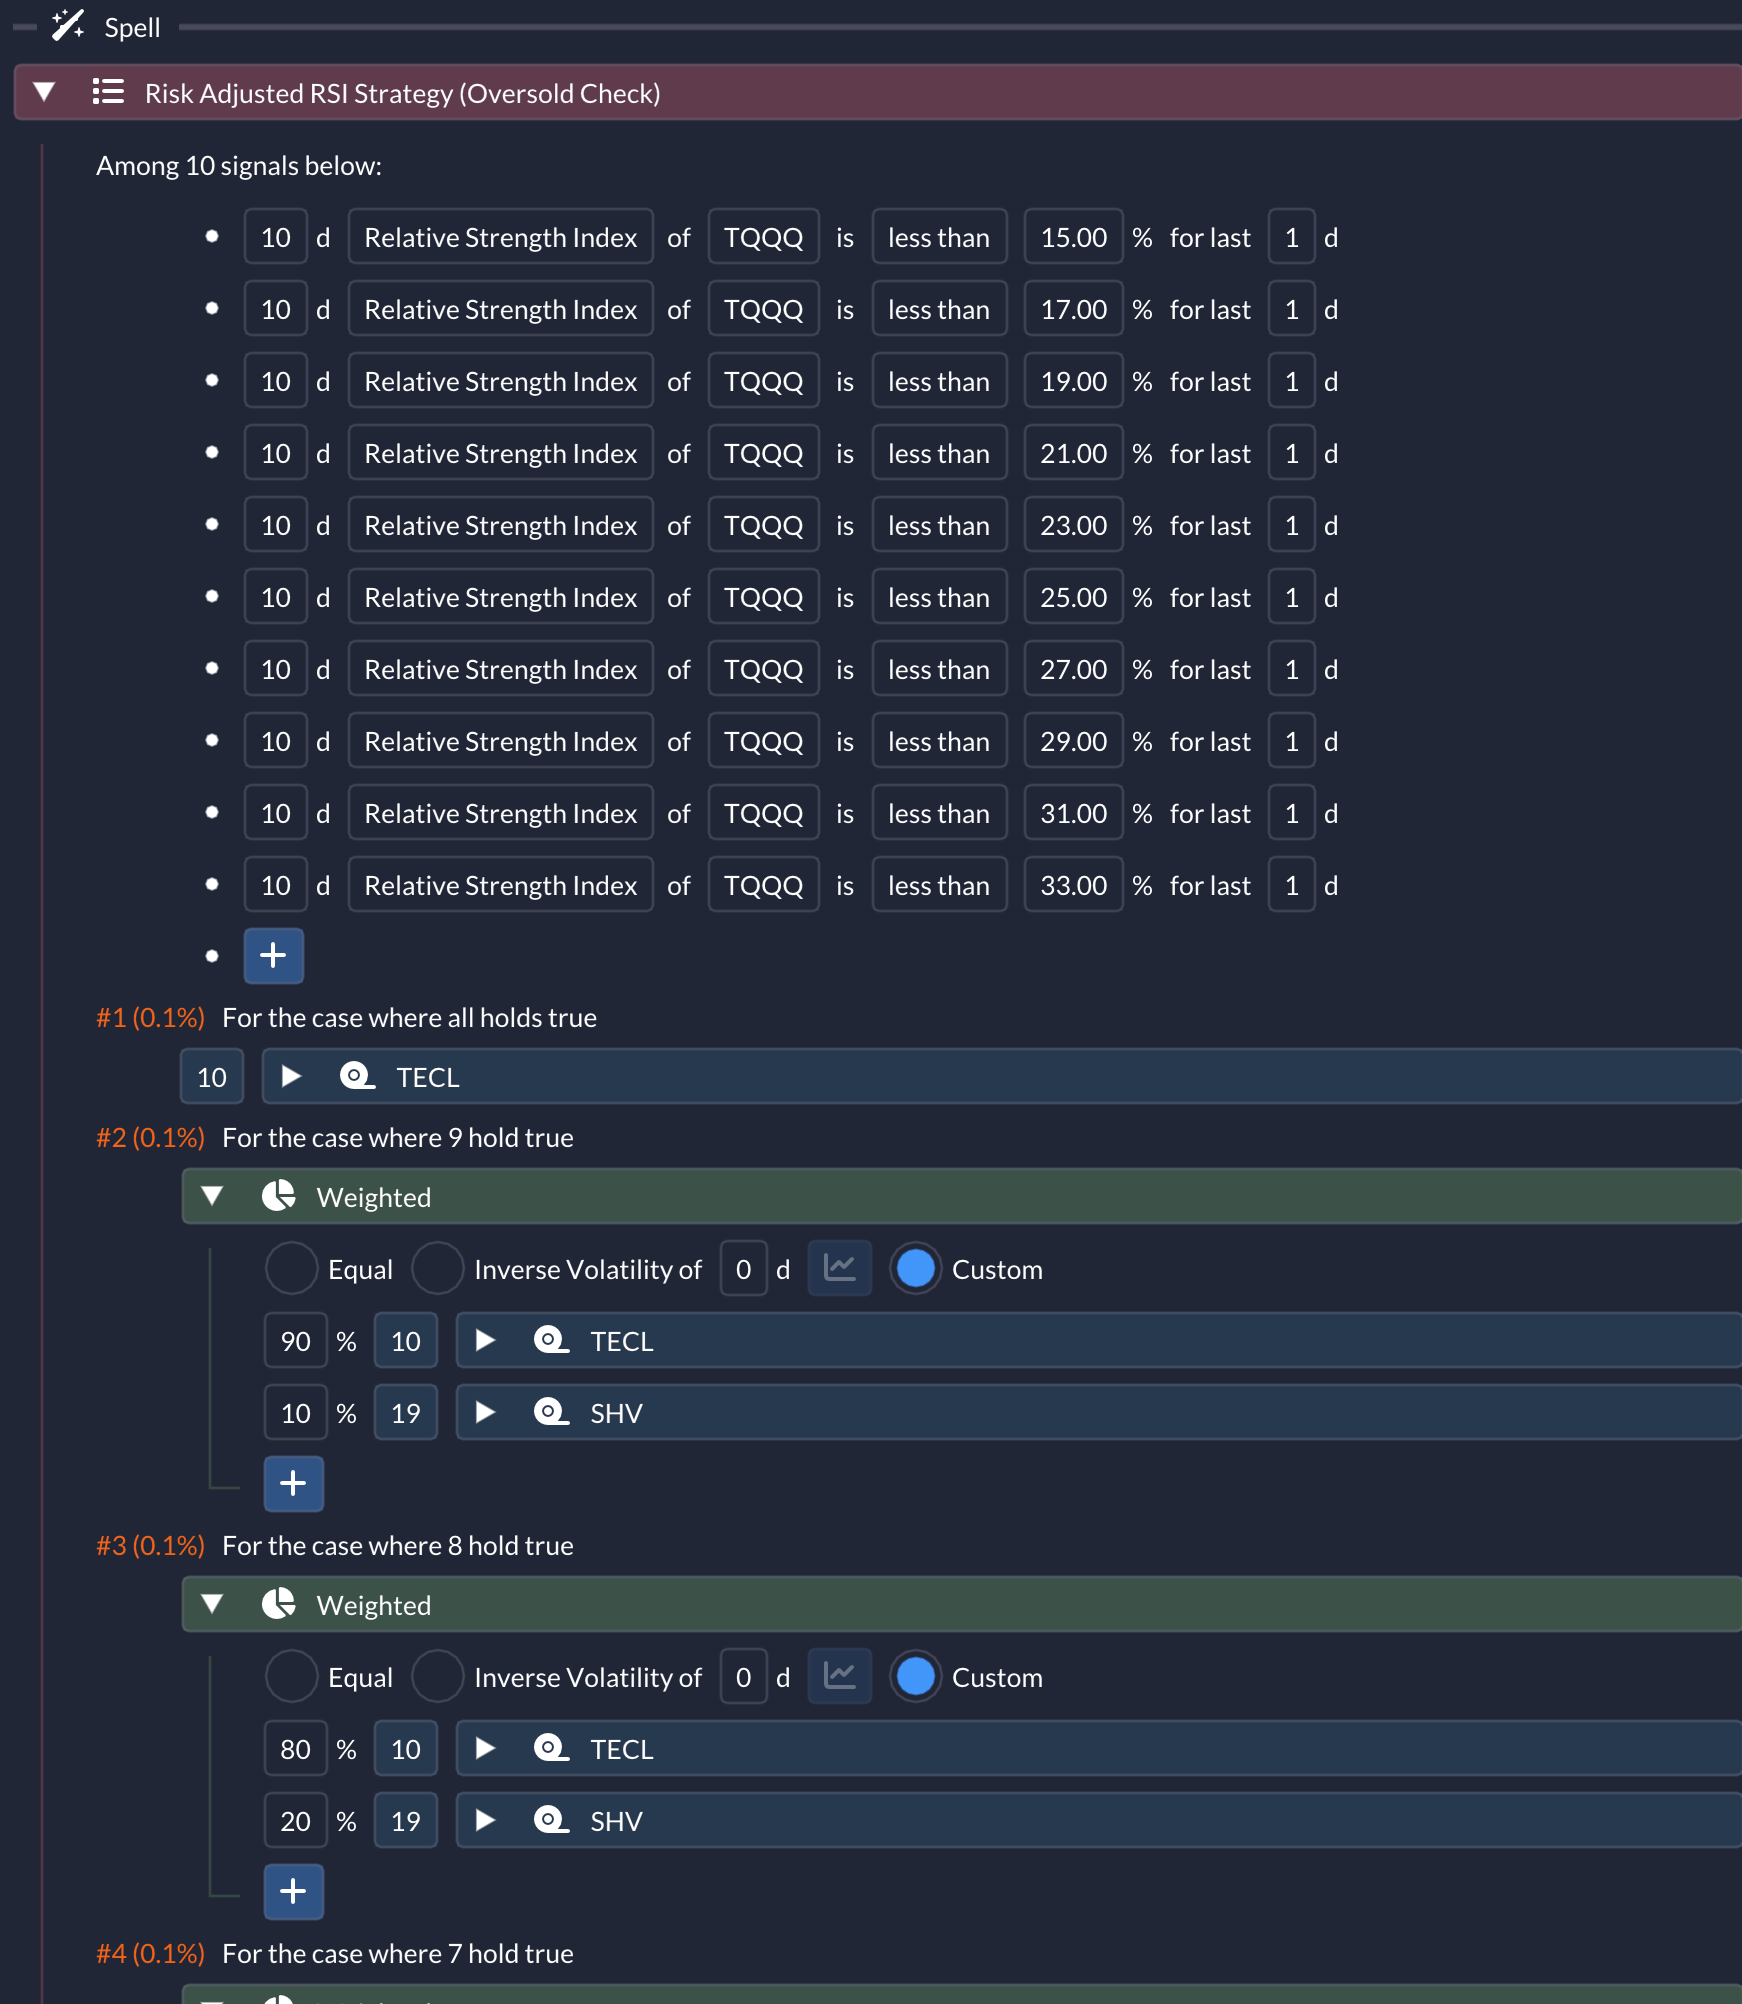
10-day RSI (of TQQQ, 3x NASDAQ-100 ETF, this time) is compared against thresholds ranging from 15% to 33%. And based on how many of those conditions are on, it adjusts the weights of TECL (3x Technology Select Sector Index ETF) and SHV (short-term treasury bond ETF) from 0% to 100%. At the end of this buy-the-dip (oversold) section, you see that its dual, the sell-the-rip (overbought) section, follows with a mirrored logic:
And its 13-year backtest shows:
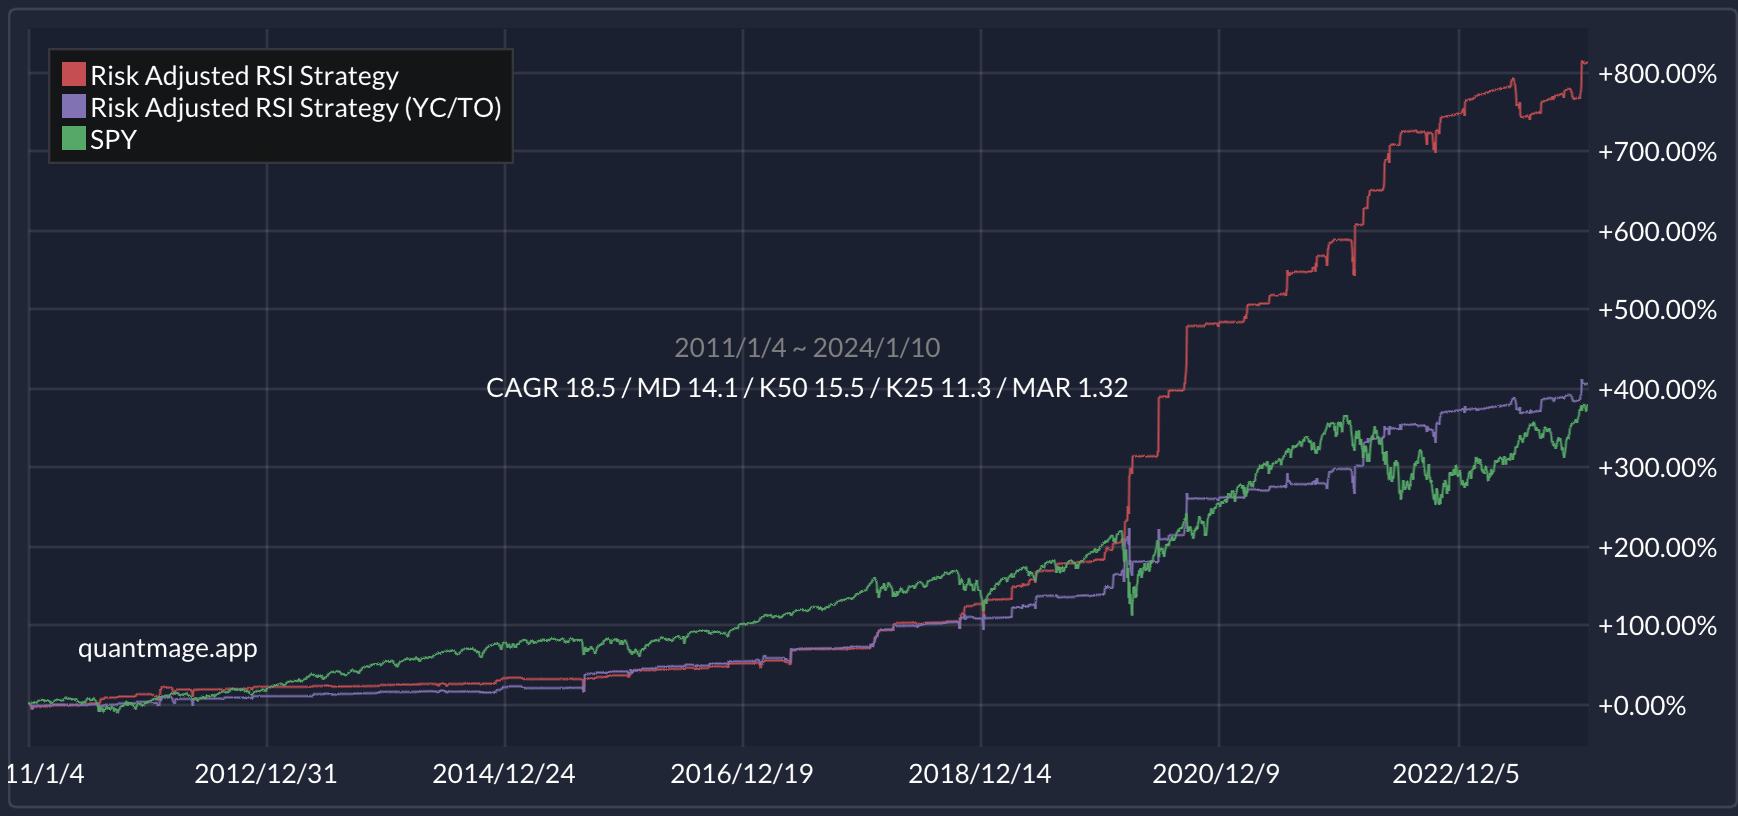
You see the similar behavior of popping in the plot. Its 18.5% CAGR and 14.1% MD is nothing to sneeze at, but it seems to be even more sensitive to timing.
You can check its entire logic and get your hands dirty here.
Final Thoughts
These RSI-based tactics might add a zing to your investment approach, but they're quite the high-wire act and might not be suitable as the core mechanism of a strategy. Still, it's an exciting area to explore and could be an eye-opener for tactical moves.
And a shoutout to the amazing discord community where I first stumbled upon these RSI tricks – it's a treasure trove of insights!
In your experience, how closely does the actual performance of a strategy as such (pops) track the backtest results when implemented in real-time trading? Does it tend to be closer to the YC/TO approach or the canonical close-to-close approach?
One strategy I've seen for the overbought 10-day TQQQ RSI swaps in UVXY. The minimum threshold for expected gain seems to be around 79%.
Although there are at least two definitions for calculating RSI that I've seen. The one that strictly uses the last ten days seems less reliable than the one that acts like a type of moving average.