
Rethinking the 60/40
Ditching Bonds for Long/Short Equity Trend Following

We've all been schooled on the classic 60/40 Portfolio – a blend of 60% equities and 40% bonds, hailed as the beginner investor's North Star. For a quick recap, check out these two implementations on QuantMage here and here. But let's talk real: 2022 was a wake-up call. The bond market, once a reliable ally, stumbled spectacularly, challenging the long-held belief of stocks and bonds moving in opposite directions. Enter inflation post-COVID stimulus, and it seems the rulebook needs rewriting. Is the 60/40 Portfolio now a relic of the past? Maybe, but what's the alternative?
Recently, I stumbled upon a thought-provoking article suggesting an intriguing pivot: replacing the traditional 40% bond allocation with long/short equity trend following. BlackRock's piece from last June echoes this sentiment. The strategy is intriguingly straightforward – it hinges on four simple moving average based signals over varying timeframes, toggling between long and short positions. The data is compelling, showing this approach not only holds its ground against stock volatility but also seems to have navigated the turbulent 2022 waters more adeptly than bonds. So I wanted to give the strategy a try in QuantMage.
Alternative Strategy
Here’s the gist: the trend following uses 100% long when all 4 signals are bullish, 50% long + 50% cash when only 3 signals are bullish, 100% cash for 2 signals only, 50% short + 50% cash for 1 only, and 100% short when none is bullish. You can merge long and short sides together when 40% of this is combined with 60% equity portion to form a final 60/40 alternative as described in the article. This results in a simplified logic as below:
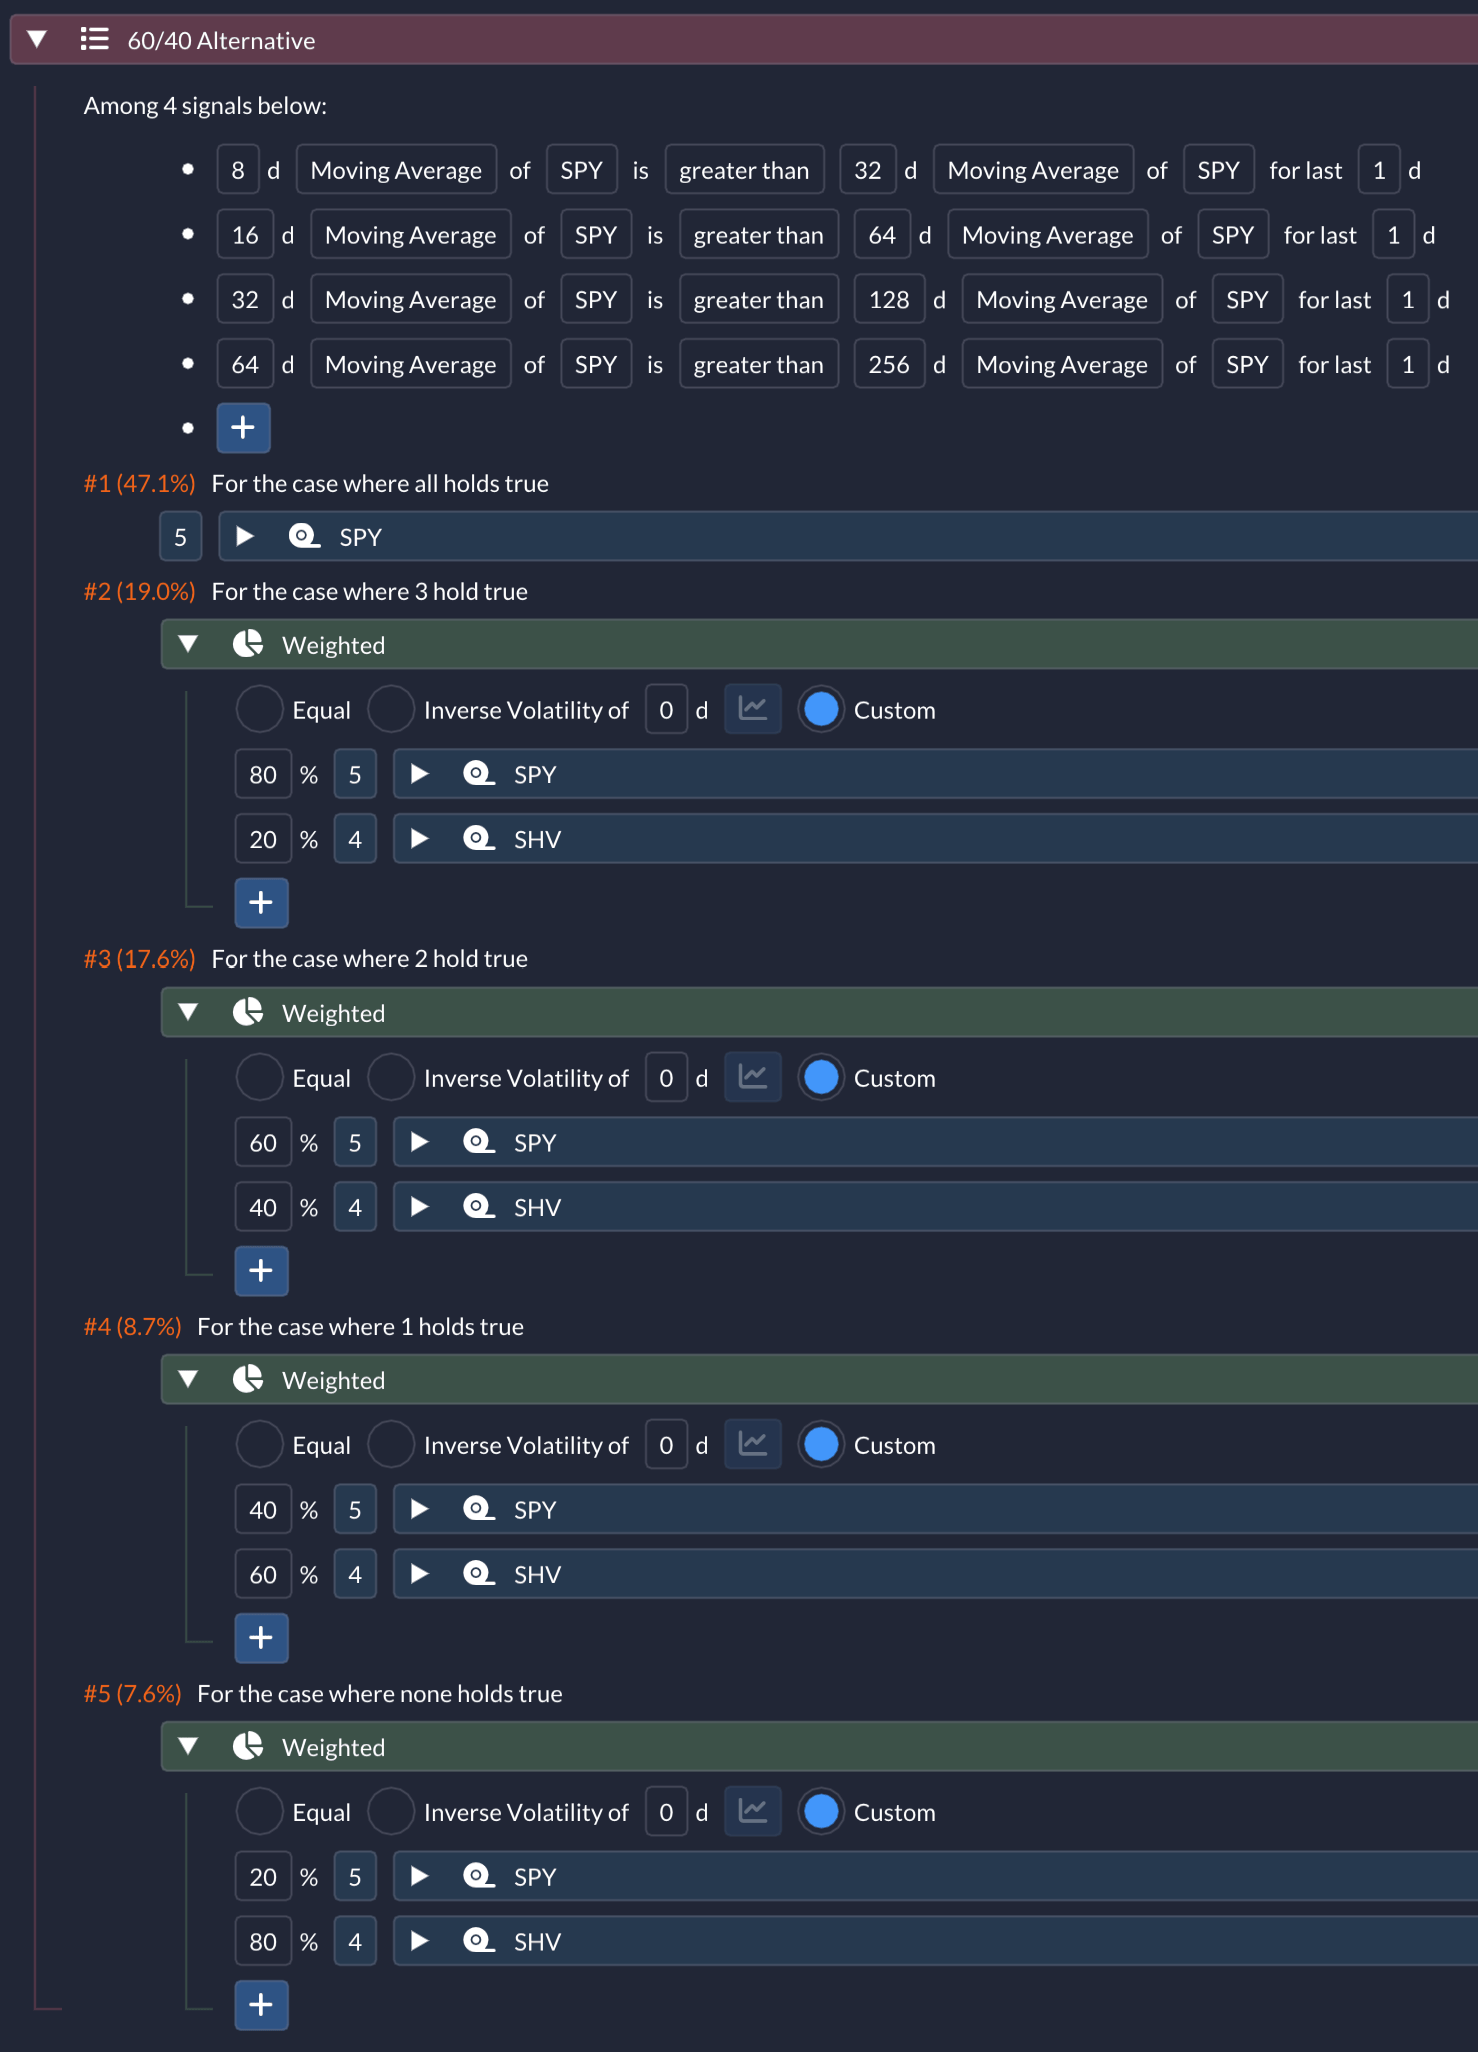
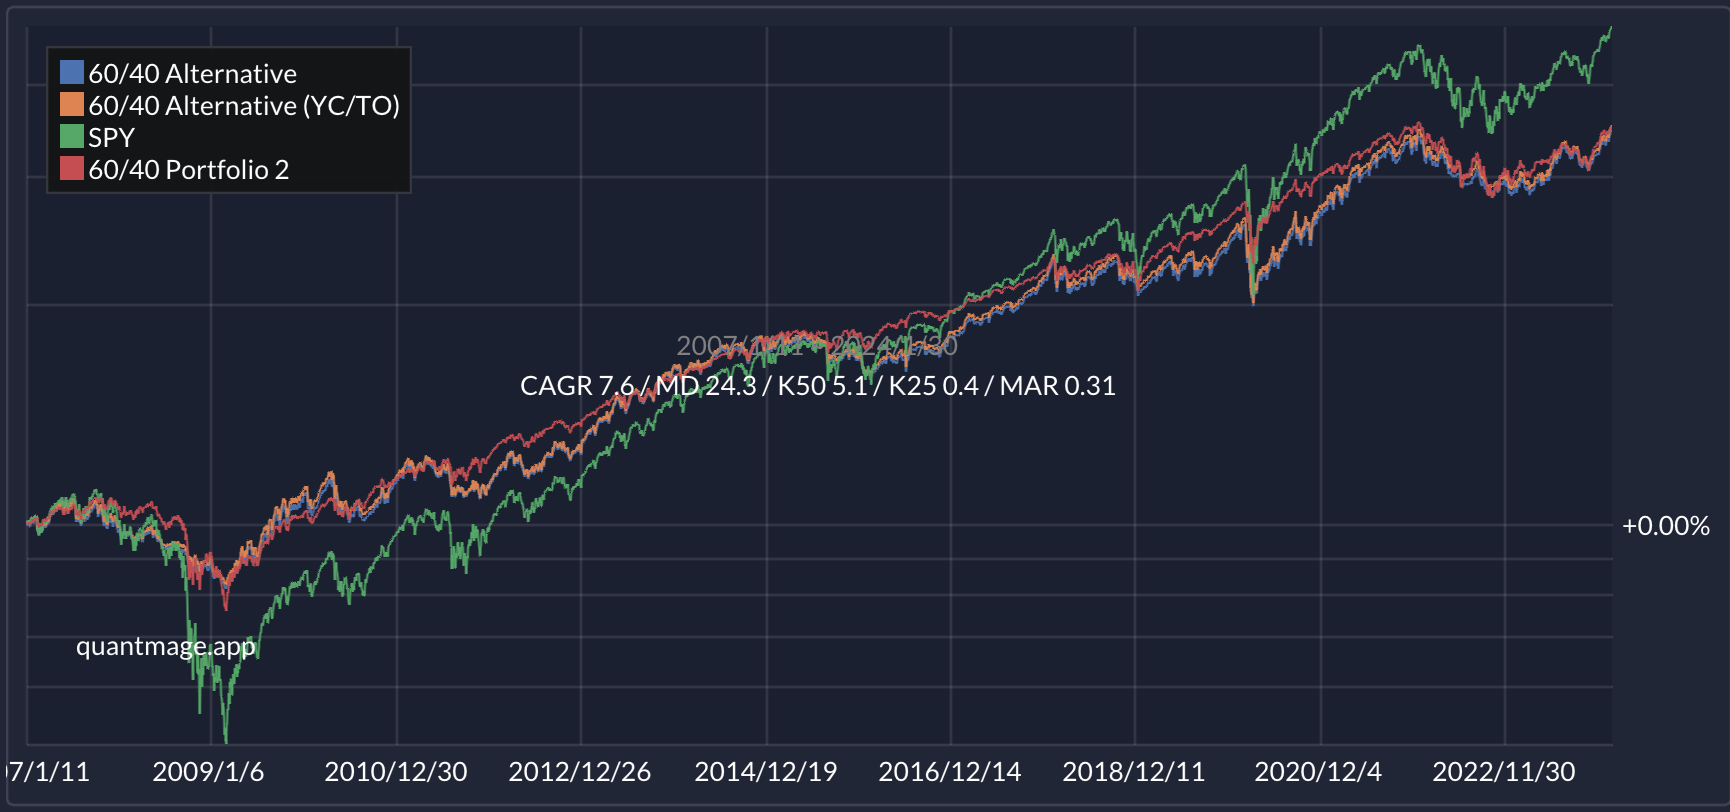
Using SPY (SPDR S&P 500 ETF Trust) for long equity positions and SHV (iShares Short Treasury Bond ETF) as our cash stand-in, the approach varies from being fully invested in SPY to a cautious 20% in bearish times. The latter case amounts to 60% SPY + 40% SH (ProShares Short S&P500 ETF). Basically 60 - 40 = 20. The result? A respectable 7.6% CAGR with a max drawdown of 24.3% over 17 years, keeping pace with the classic 60/40 (see the red line in the graph below):
Proto Strategy
To really get under the hood, I also explored a “proto” version of this strategy in QuantMage, one that doesn't merge the long and short sides. This version offers insights into the strategy's mechanics and helps verifying some claims made in the original article:
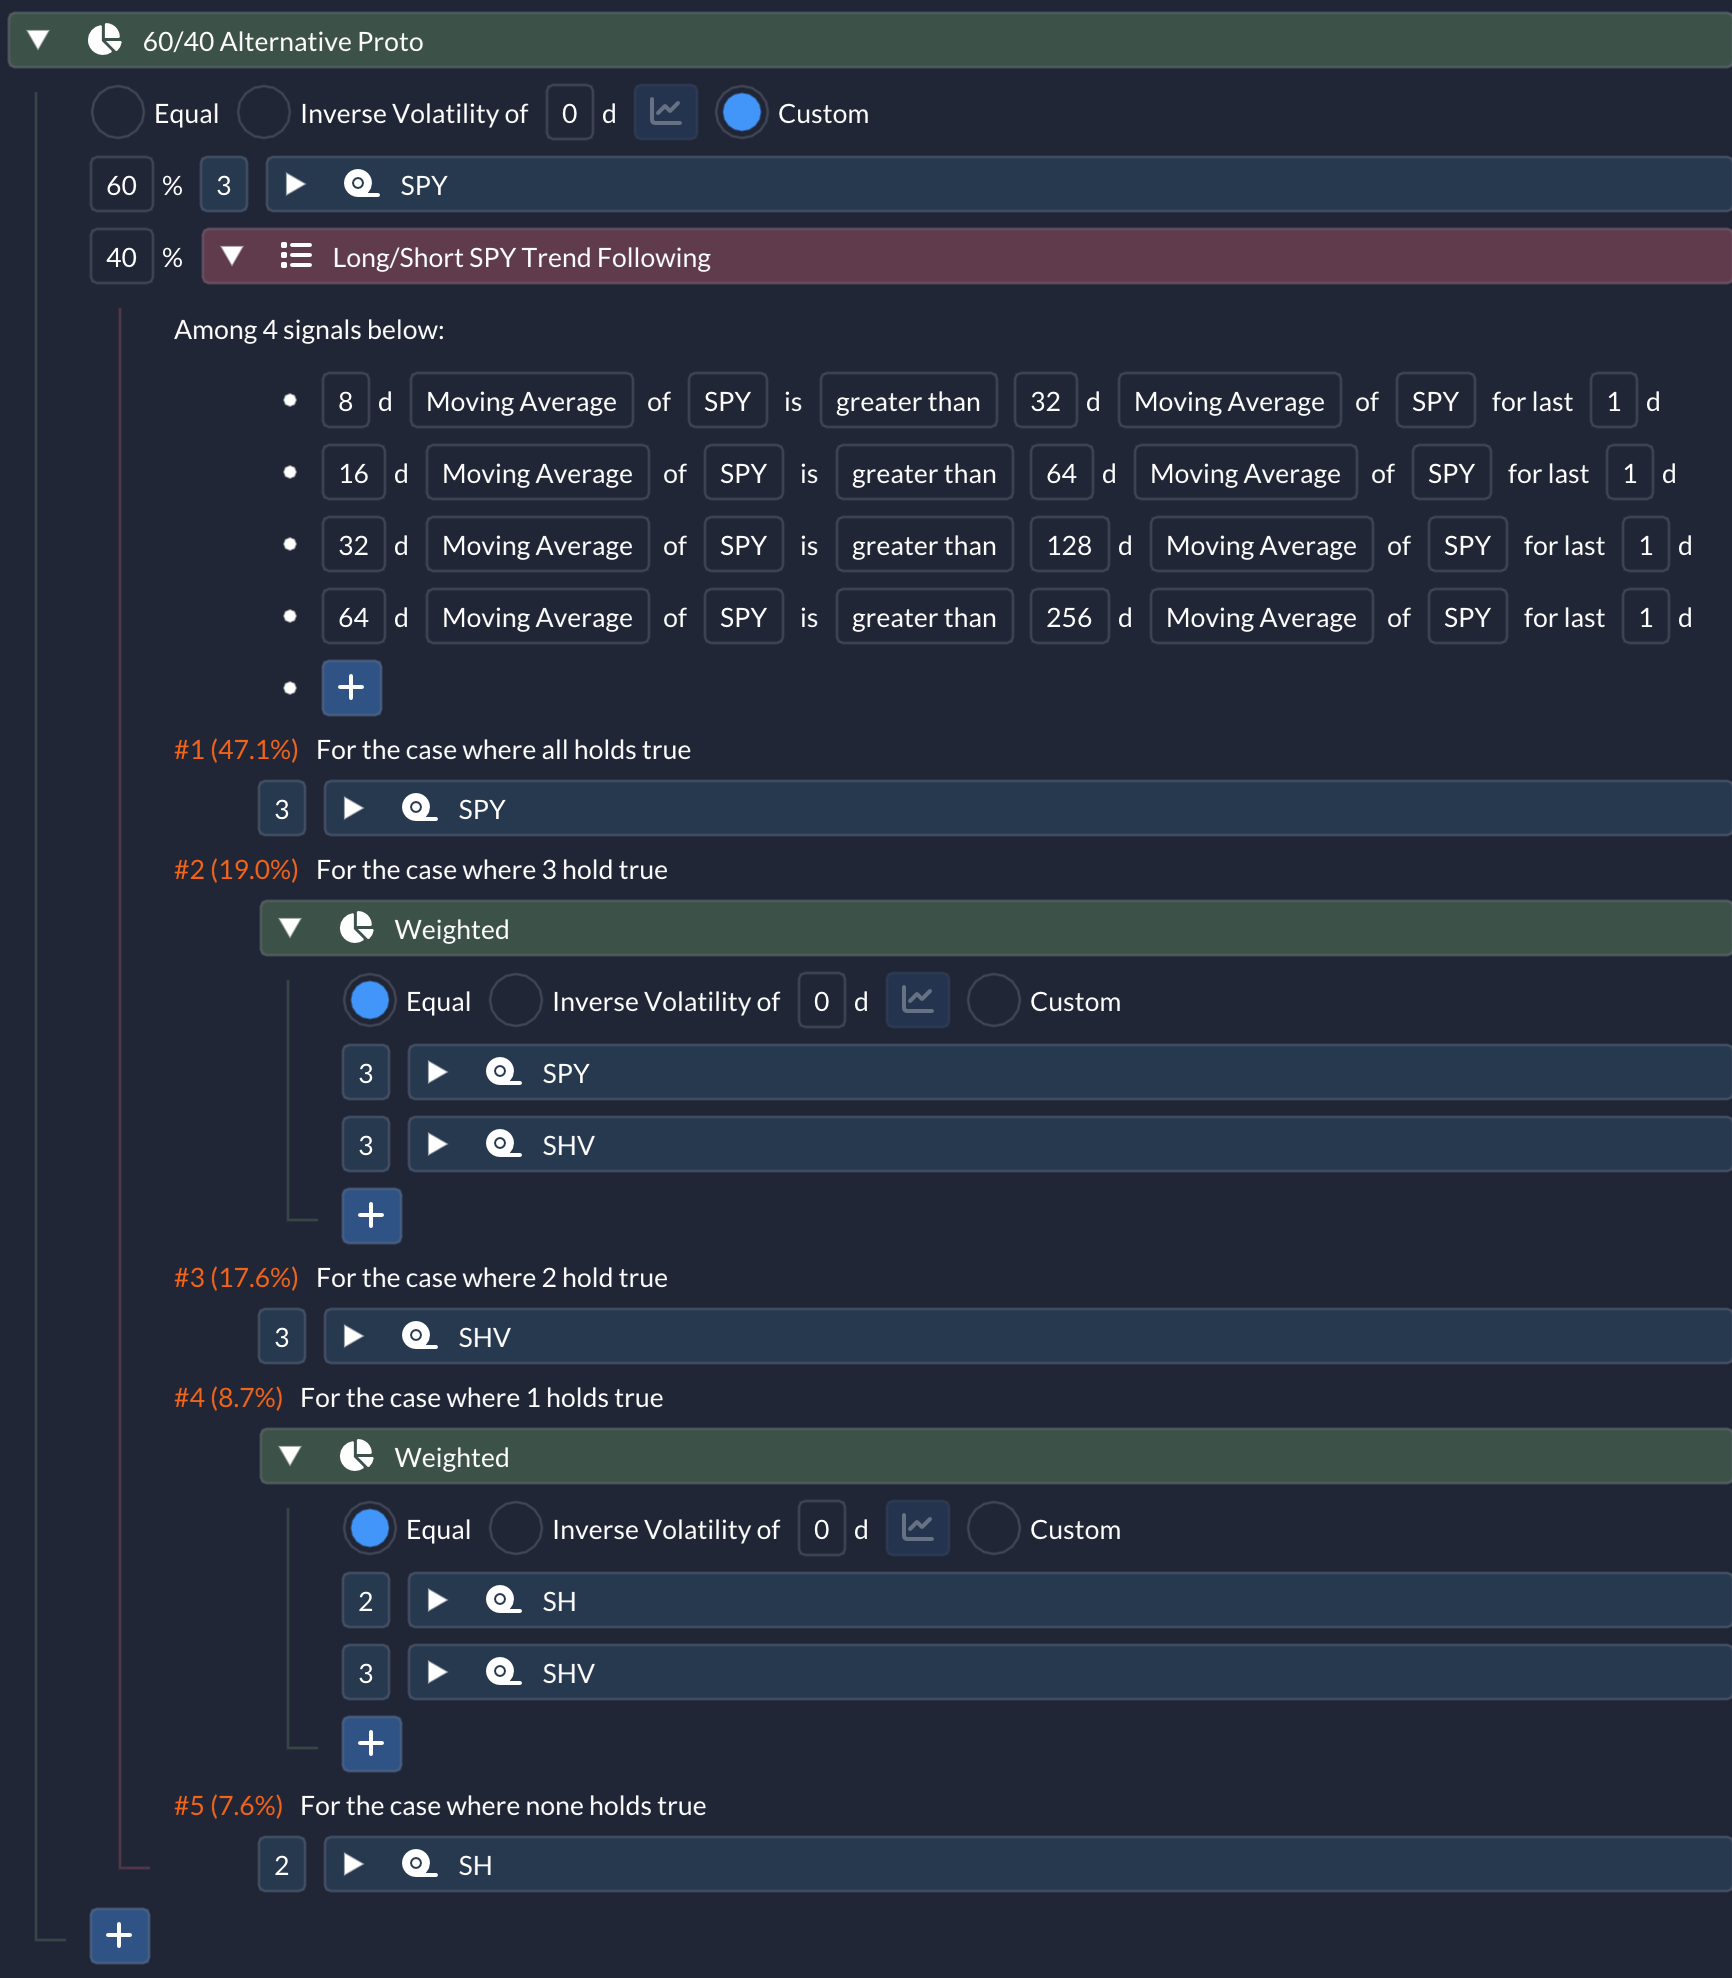
Again, SH is used for shorting. Both versions are up for comparison here and here, and they perform quite similarly as expected. Please note that both of them are using threshold rebalancing given the long/short portion’s dynamic nature instead of annual rebalancing used for the traditional ones.
Low Correlation
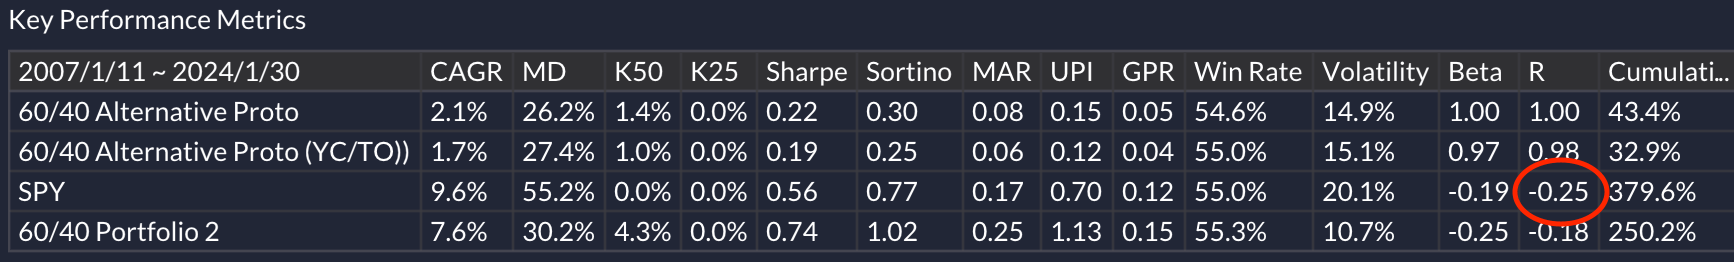
But does this strategy truly offer low correlation with SPY? The proto version, when weighted 100% towards the long/short section as follows:
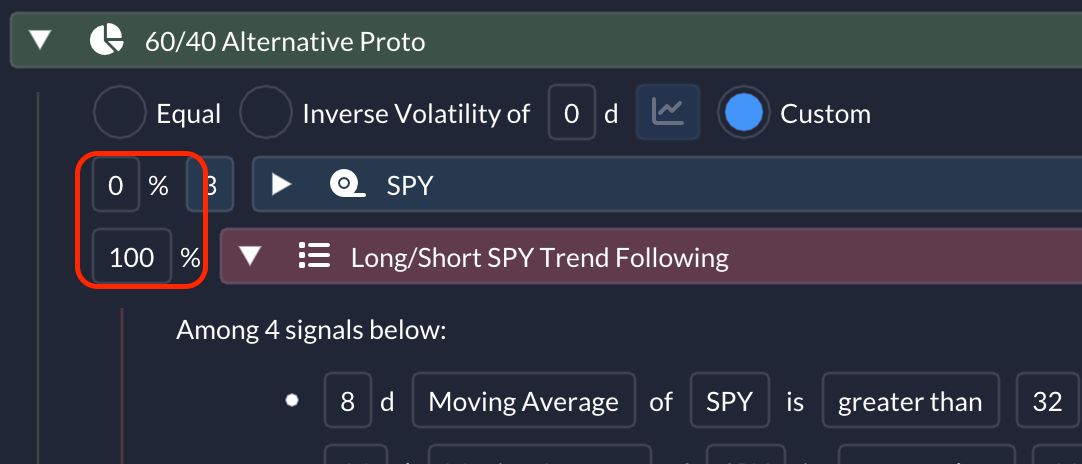
reveals a negative correlation of -0.25 with the benchmark ticker. Now that's encouraging!
2022 Drawdown
How did it fare as a diversifier during 2022's market rollercoaster? Did it meaningfully outperform bonds in the timeframe between Jan and Oct of 2022 as the article claims? Continuing from the change above, I reran the backtest after changing the benchmark ticker to IEF (iShares 7-10 Year Treasury Bond ETF) this time:
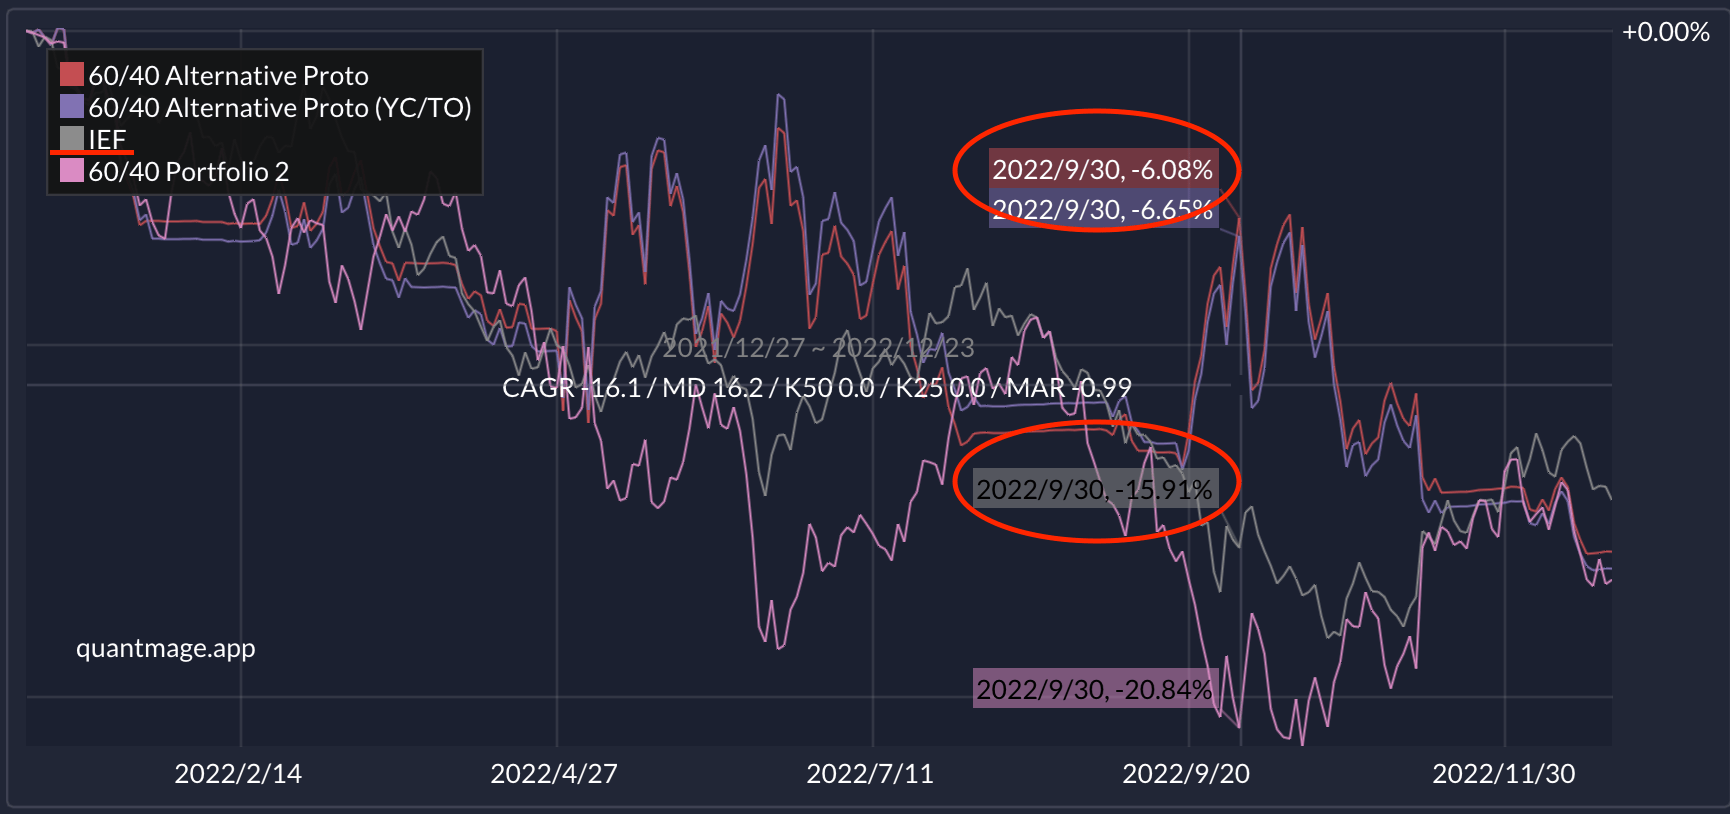
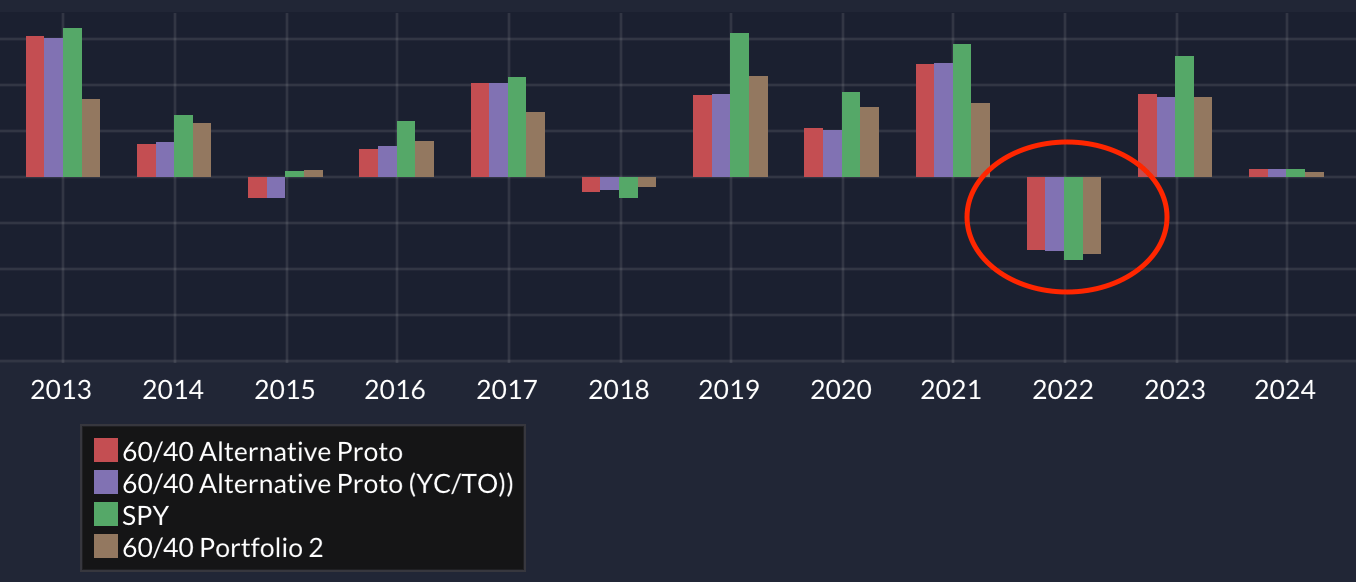
It indeed fared better than the bond! It ended up at a similar drawdown as the classic 60/40 for the whole year, though. Check the following yearly returns in the stats once you rerun a backtest after reverting the temporary changes:
Your Verdict?
So, what's your take? Could long/short equity strategies be the diversification hero we need? While it might not be time to completely ditch bonds, incorporating this strategy as an additional diversifier could be a wise move. Got any other tricks up your sleeve to revamp the 60/40? Let's hear them!
And remember, folks, this is just food for thought. I'm not here to play financial advisor – always do your due diligence and maybe have a chat with a pro before making any leaps.