
P-value and Bootstrapping
Two Neat Ways to Gauge Your Strategy's Efficacy


I recently stumbled across an excellent article from Concretum that showcases two neat statistical methods for evaluating how well an investment strategy is working. I ended up adding these techniques to QuantMage, and in this post, I’ll walk you through the basics, point out their quirks, and share my thoughts on their real-world usefulness.
P-value
If the term “Student’s t-test” brings back hazy memories of your stats class, don’t sweat it. In plain English, a one-sided t-test examines how likely it is that a strategy showing positive returns is really just a fluke. In other words, we start with a “null hypothesis” that says your strategy has no advantage—its expected return is zero—and then ask: What are the odds that a no-edge strategy could still produce returns as good as the ones we’re seeing? The p-value spits out that probability. The smaller the p-value, the less likely your strategy’s gains are just random luck. Concretum suggests shooting for a p-value under 1%, which indicates a solid level of confidence. If you’d like more details, check out QuantMage’s breakdown here.
Bootstrapping
Bootstrapping is a different animal: it’s a resampling technique where you create a bunch of hypothetical “year-in-the-life” return paths by pulling random daily returns from your actual historical data (with replacement). After simulating, say, 1,000 such years, you count how many ended up in the red. The percentage of negative outcomes is your bootstrapping loss rate. This number tells you how likely it is that even a strategy with real positive edge might still have a losing year—just because returns naturally bounce around. A lower loss rate suggests your strategy should hold up better against volatility. You can see how QuantMage explains it here.
Caveats
P-values and bootstrapping are helpful, but they’re not silver bullets. For starters, they don’t say anything about whether you’ve overfitted your strategy by mining historical data until something looked good. Also, both methods ignore any time-based patterns in stock returns—like momentum or mean reversion—that could affect the results.
The p-value approach makes assumptions too. It assumes returns follow a log-normal distribution (i.e., log returns are normally distributed), which doesn’t fully capture those nasty fat tails or skewed distributions that show up in real markets. Bootstrapping, while non-parametric, doesn’t fix the autocorrelation blind spot either.
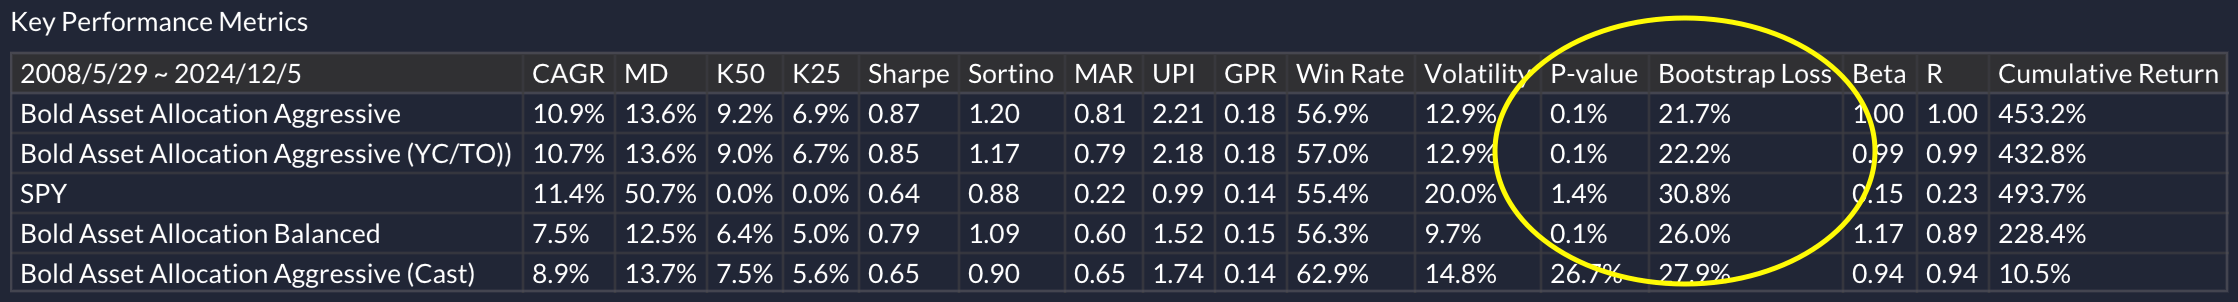
In practice, I’ve also noticed these stats may not always separate the good from the great. Many of my current strategies already produce impressively low p-values—often near zero. Bootstrapping results were a bit more telling, with loss rates mostly under 20–30%, and some in the single digits. That’s not bad, but it’s also not a magic wand that tells me, “This is the winner!”
What do you think? Do you find these measures handy for gauging your strategies, or do you have other go-to tests and metrics you prefer? I’m always open to learning about new approaches that can cut through the noise and help me build more robust investment strategies.