
JJ's Spell Series: BDRY-signaled SSO/EUM with RSI Pops
Three Ideas, One Strategy


It’s time to unveil another “live spell” from my market cauldron—this one a three-part strategy that’s pulled off some impressive feats in backtesting (and hasn’t embarrassed itself live, either). This blend is all about mixing signals, catching regime shifts, and, as always, trying to keep risk in check.
🚨 Quick disclaimer: This post is for informational purposes only and not investment advice. Past performance doesn’t predict the future, and this strategy could be tweaked or nuked at any time. Always do your own research!
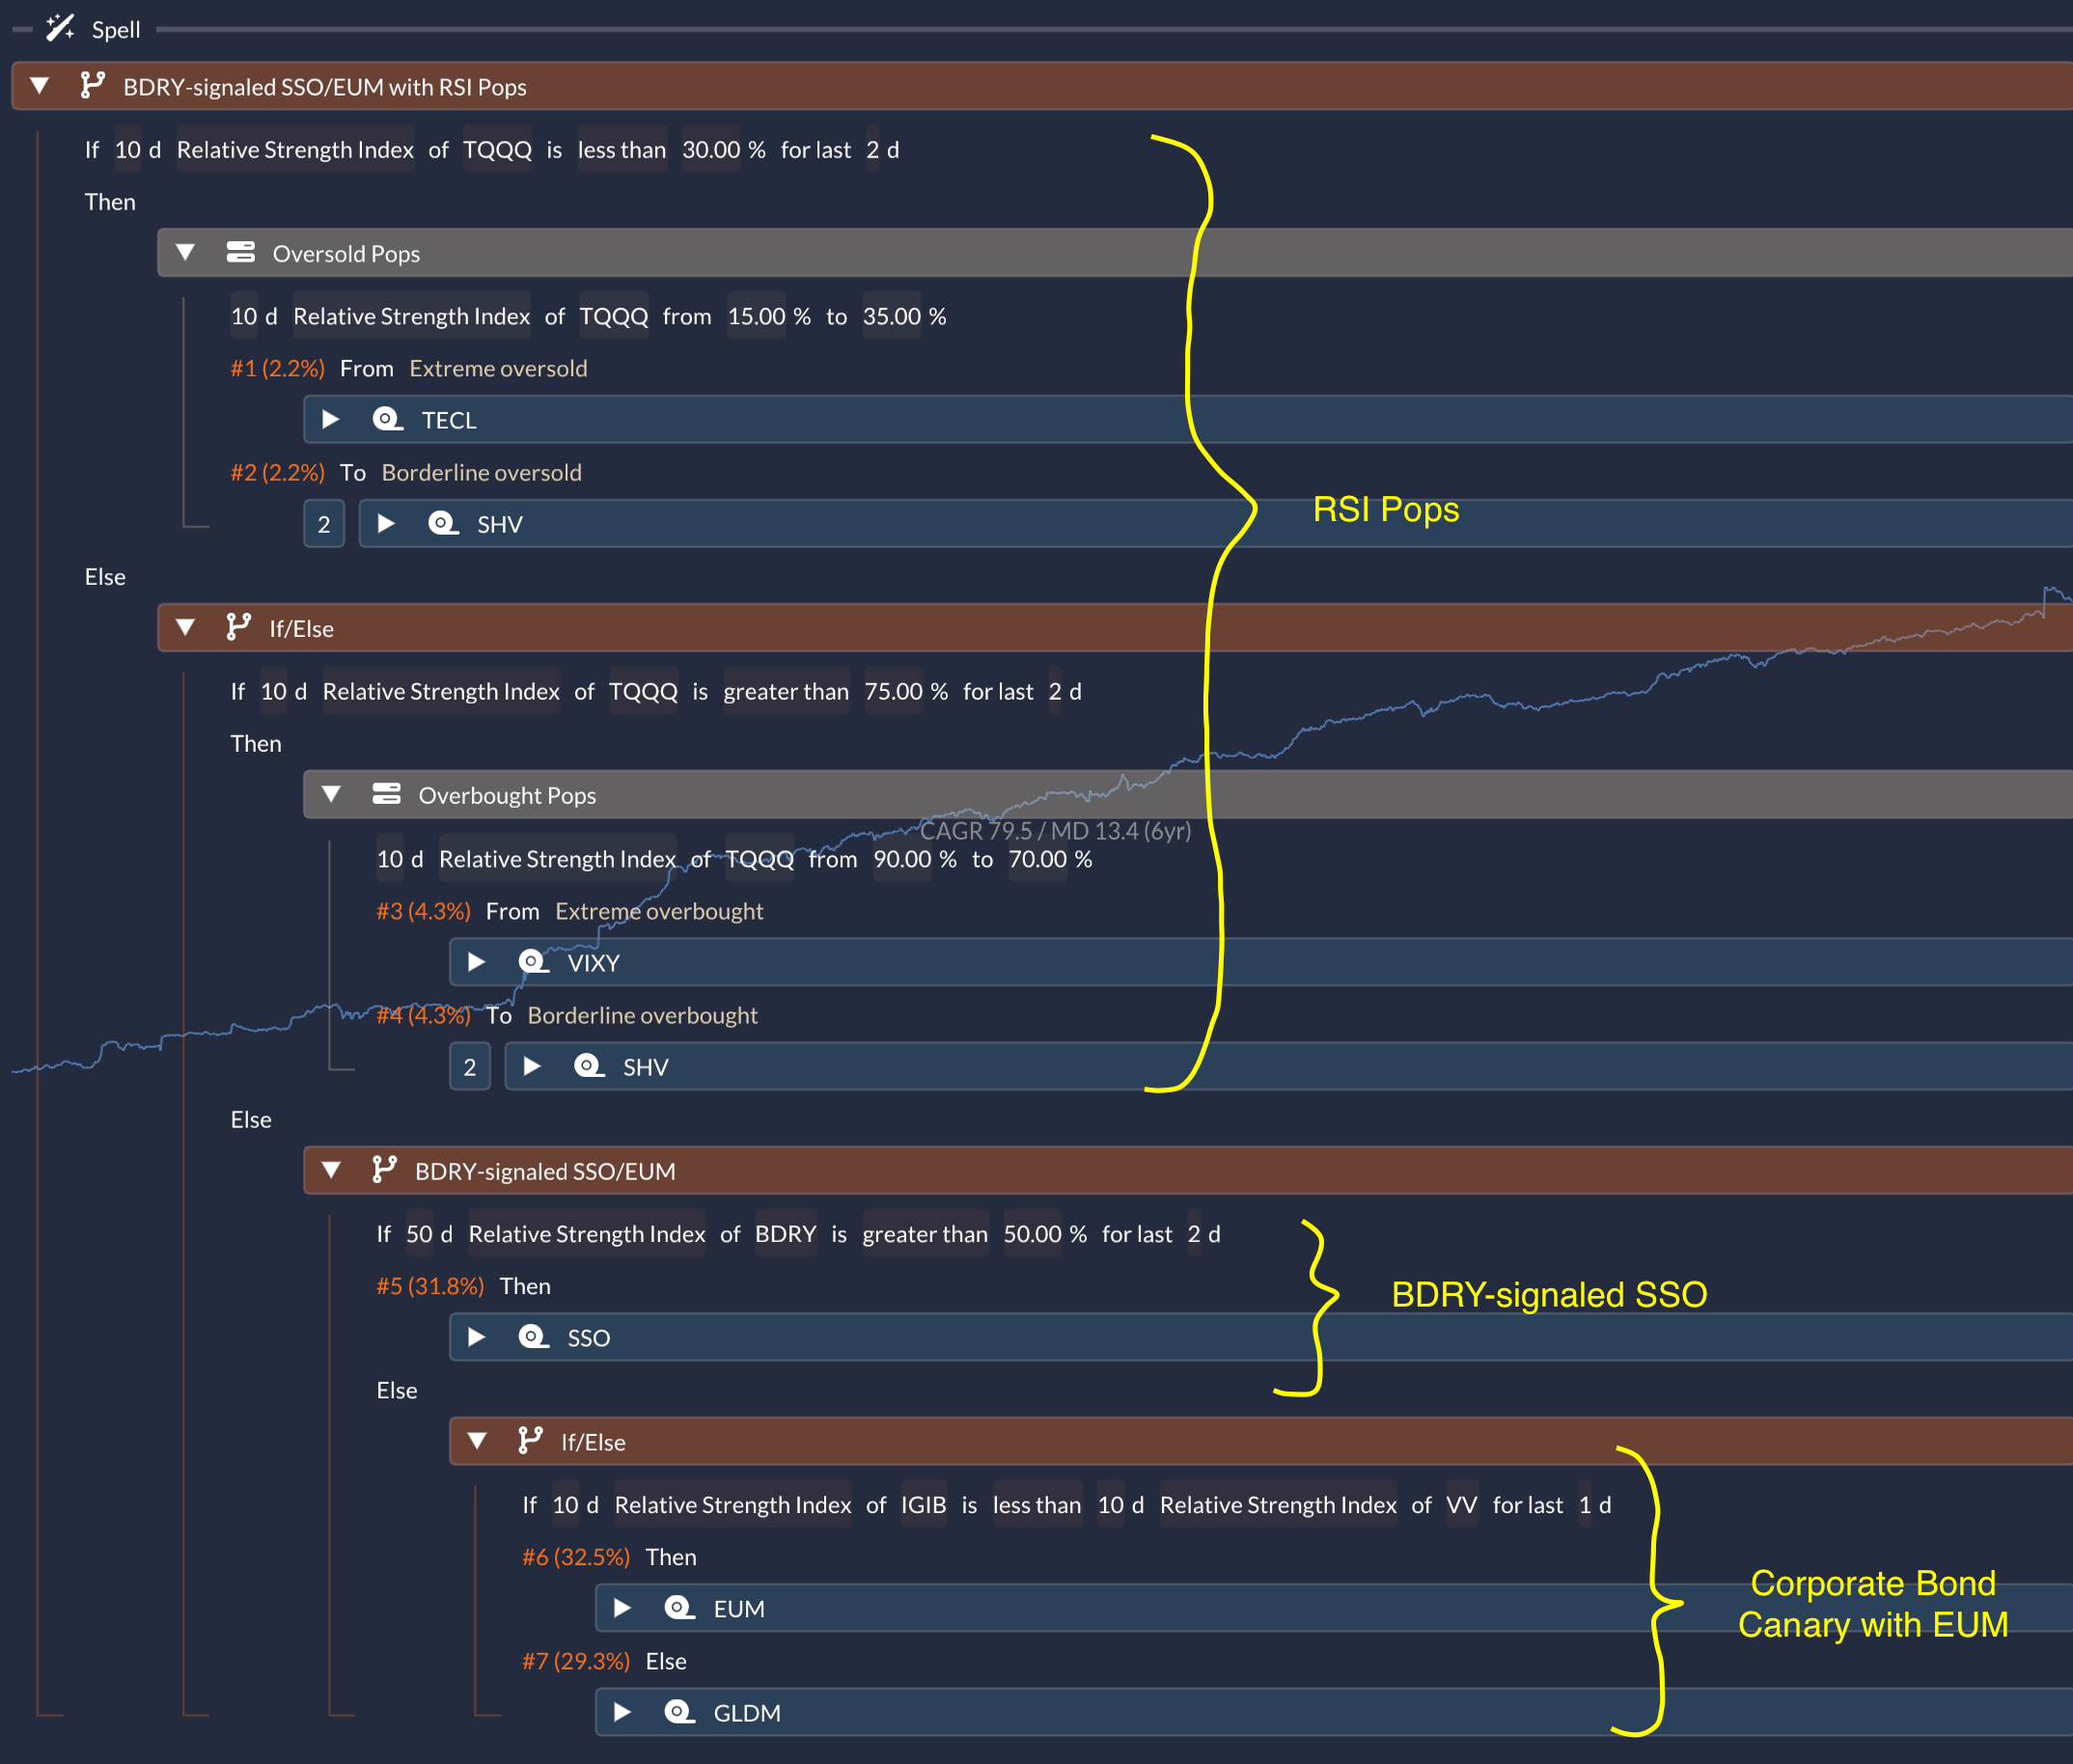
🌀 RSI Mean Reversion Magic
First up: a mean-reversion mechanic based on the 10-day RSI of TQQQ, the 3x levered Nasdaq-100 ETF. When RSI flags overbought or oversold conditions, the strategy makes a move—but instead of going all-in, it uses a “Mixed” allocation to size the position more cautiously. This helps ride the potential bounce while keeping risk in check.
You can find more on this RSI-based tactic here.
🚢 BDRY as My Market Canary
Here’s where things get a little weirder. BDRY—the dry bulk shipping ETF—serves as my “canary in the coal mine.” When shipping rates look healthy (as signaled by BDRY), that’s my cue to lean bullish: I move to SSO, the 2x levered S&P 500 ETF.
I’ve dug into the thesis on why shipping matters as a macro signal in this post.
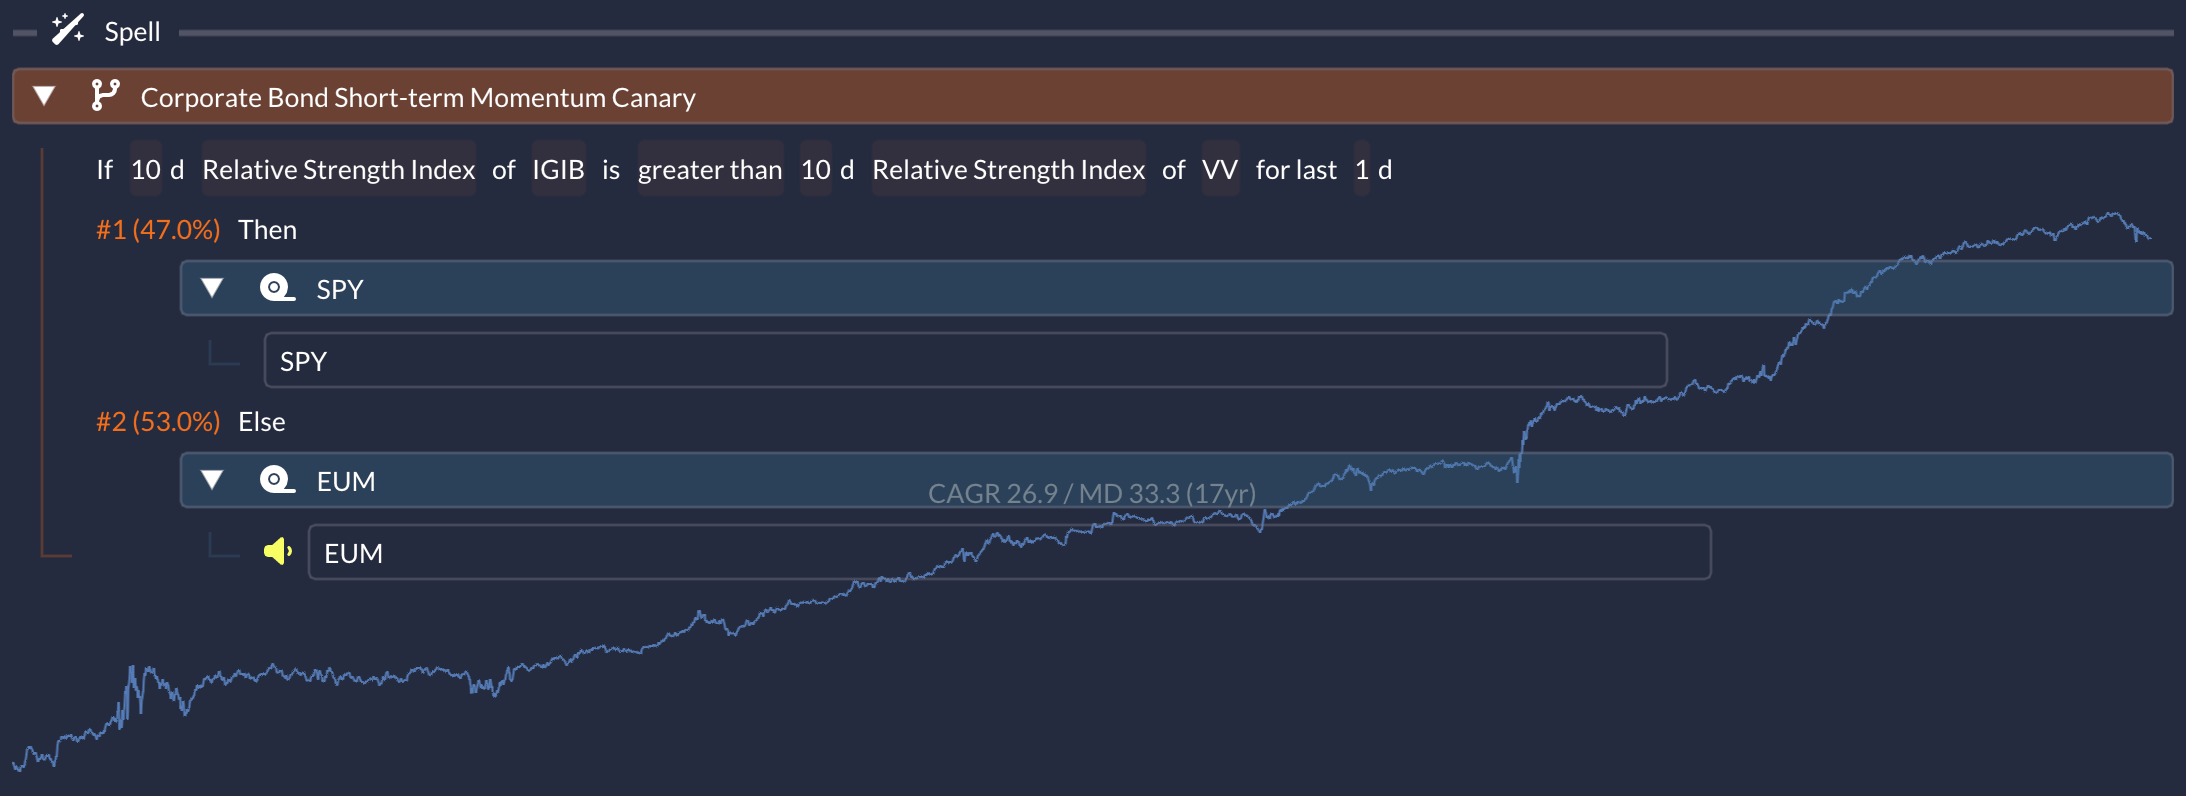
💼 The Corporate Bond Twist
But what if BDRY goes risk-off? That’s when my second canary (a corporate bond short-term momentum filter) steps in. If it sees risk-on even when BDRY disagrees, I use GLDM (gold ETF) as a hedge. But if both canaries squawk “risk-off,” I flip to EUM (the inverse emerging market ETF) as a more aggressive defensive play. EUM’s behavior as a tactical short has held up surprisingly well as a risk-off tool when signaled by the corporate bond short-term momentum:
📈 Combo Performance: A Powerful Trio
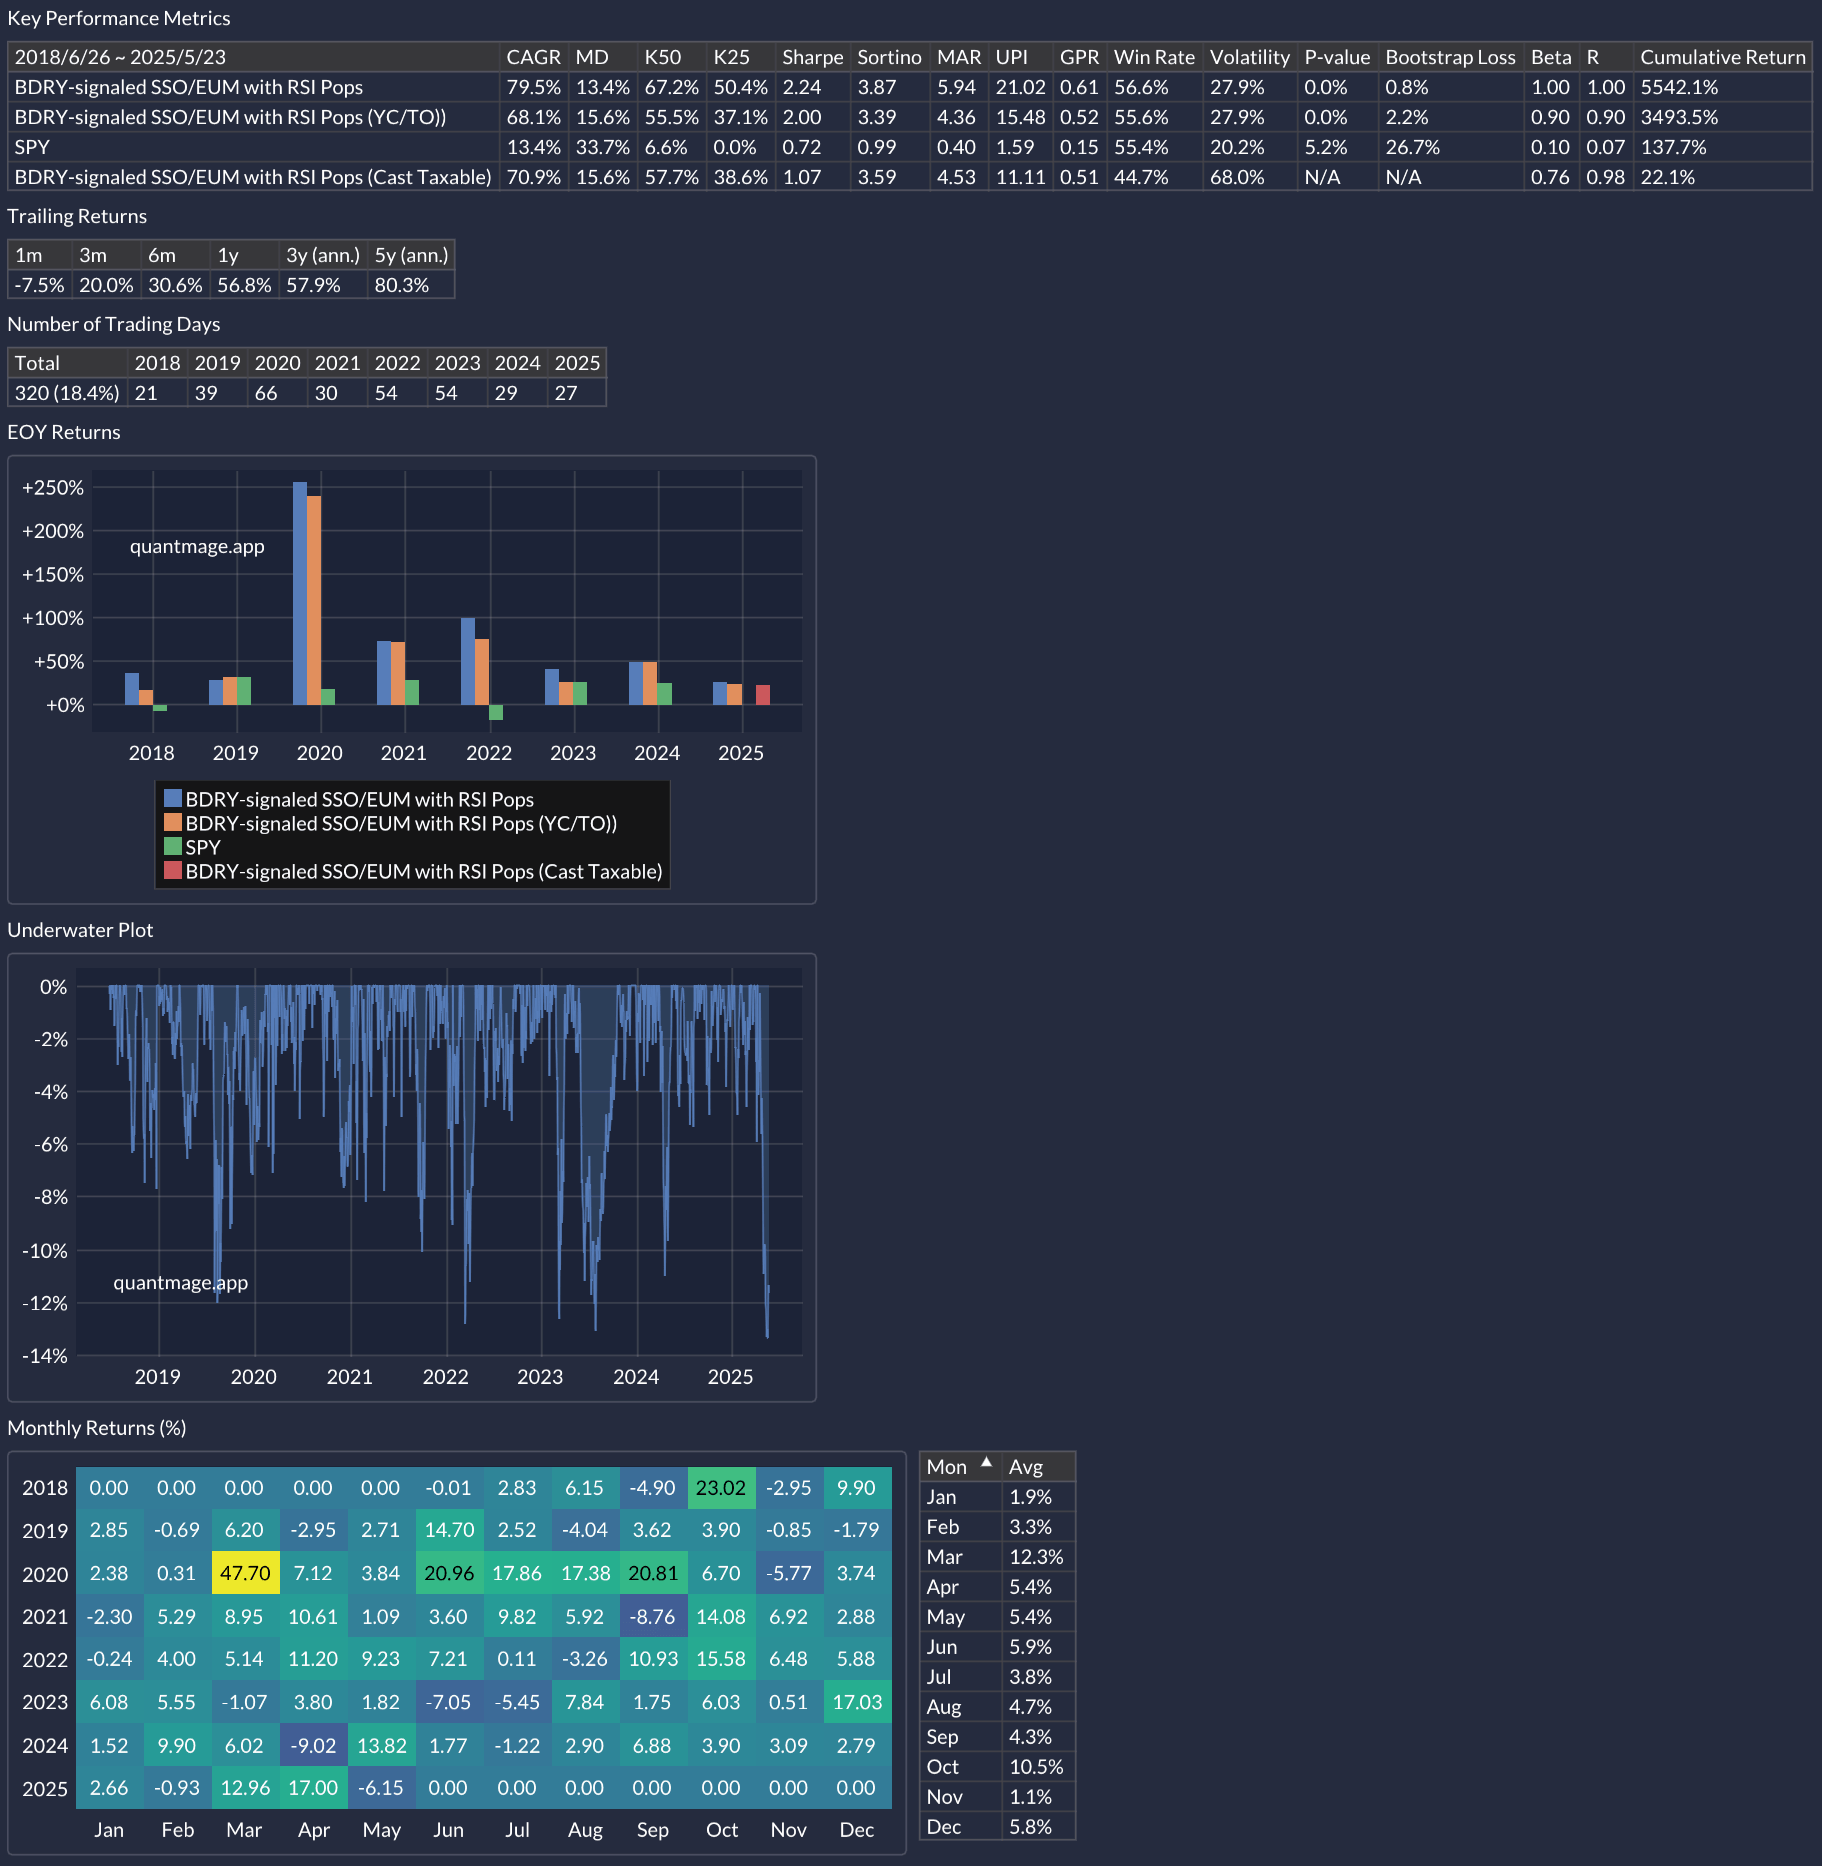
Okay, so we’re only looking at about 6 years of data here (short track record, I know), but the performance has been pretty wild: 79.5% annualized returns with just a 13.4% max drawdown. What really gets me excited though? The 0.07 correlation to SPY. This thing basically does its own thing.
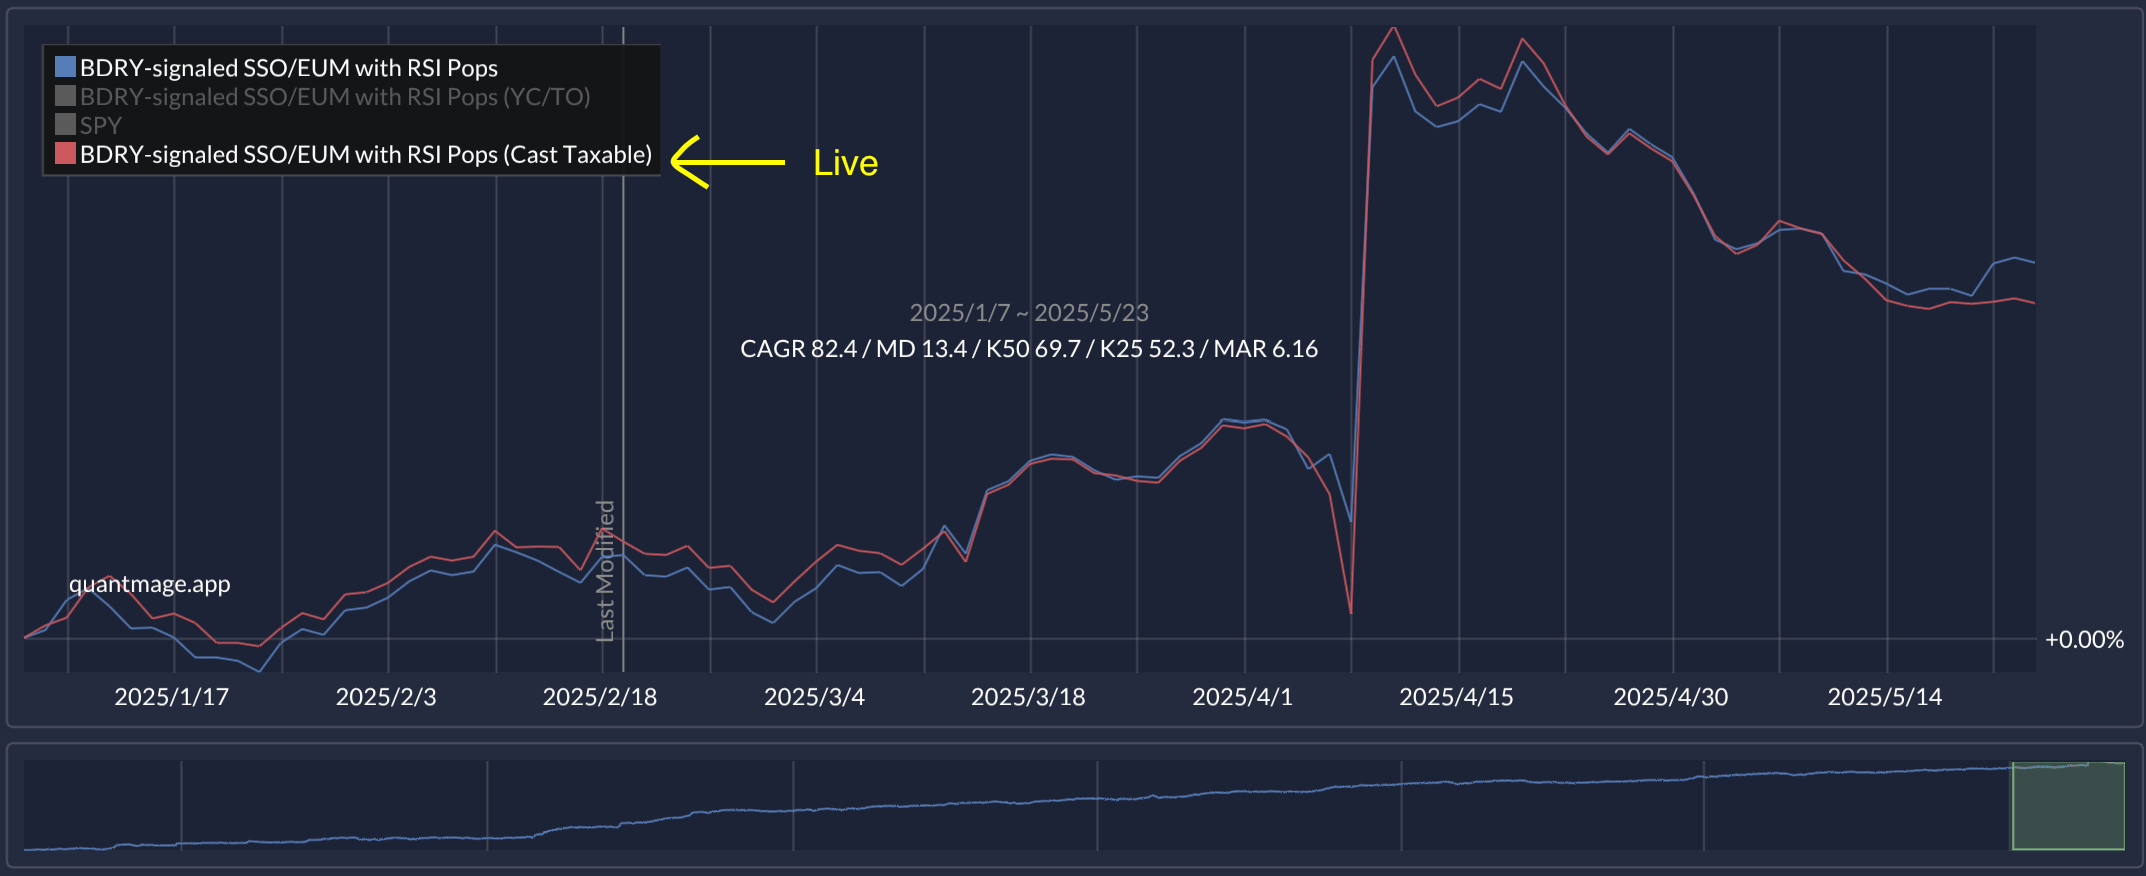
The real test, of course, is live performance—and after five months running this “spell” for real, results are (so far) sticking pretty close to simulation:
Curious to test or tweak this spell yourself? Feel free to experiment with it here.
🔍 Bottom Line
So—what do you think? Do the individual theses and the way they’re stitched together make sense, or do you sense the faint aroma of overfitting or the usual tactical-strategy traps lying in wait? As always, I welcome skepticism, counterpoints, and any “here’s why this will blow up” stories from your own experience.
Drop me a reply, challenge my logic, or just lurk and watch what happens next.
thanks for this great article.
I compared the stats to the recent stats you published in the latest portfolio update post and the numbers still hold:
55.8% CAGR and 17.6% MDD (this went up a little ), volatility was doubled at 49.1% and the SPY correlation is now high 0.55 not as good as in the backtest from 2018 0.09
how do you explain the change in both volatility and R?
This is a very interesting strategy!! Haha.
But I have two questions.
In the first condition, it says that the condition below is triggered only when the RSI is below 30 for 2 consecutive days. But below it says that it is when the RSI is between 15% and 35%.
1. What does this mean? If the RSI is 32%, this condition itself does not apply, right? Then the condition below should be between 15% and 30%, right?
2. What are the criteria for extreme oversold, borderline oversold, extreme overbought, and borderline overbought?