
Canary Signal Series: The Baltic Dry Index—Your Market Weathervane
How the Cost of Shipping Raw Materials Could Predict Economic Swells

Ever thought about how the price of shipping coal or grain across the ocean might hint at the next market boom or bust? Enter the Baltic Dry Index (BDI). Published by the London-based Baltic Exchange, this index measures the cost of moving major raw materials—like coal, iron ore, cement, and grain—across the world’s seas. It’s considered a leading economic indicator because it reflects the demand for shipping capacity versus the supply of dry bulk carriers.
Why does this matter? It’s pretty intuitive: strong economic growth ramps up the need for raw materials, which means more ships are needed to move them. Since the supply of cargo ships can’t instantly adjust (building a new ship takes time), increased demand pushes shipping costs higher. I first learned about using the BDI as a market “canary in the coal mine” from an insightful blog post. Then, I stumbled upon a research paper exploring how the 3-month growth rate of the BDI can predict stock returns. Naturally, I had to test this thesis using QuantMage.

EMA Crossover: Surfing the Economic Waves
First up, I tried the exponential moving average (EMA) crossover strategy mentioned in the blog.
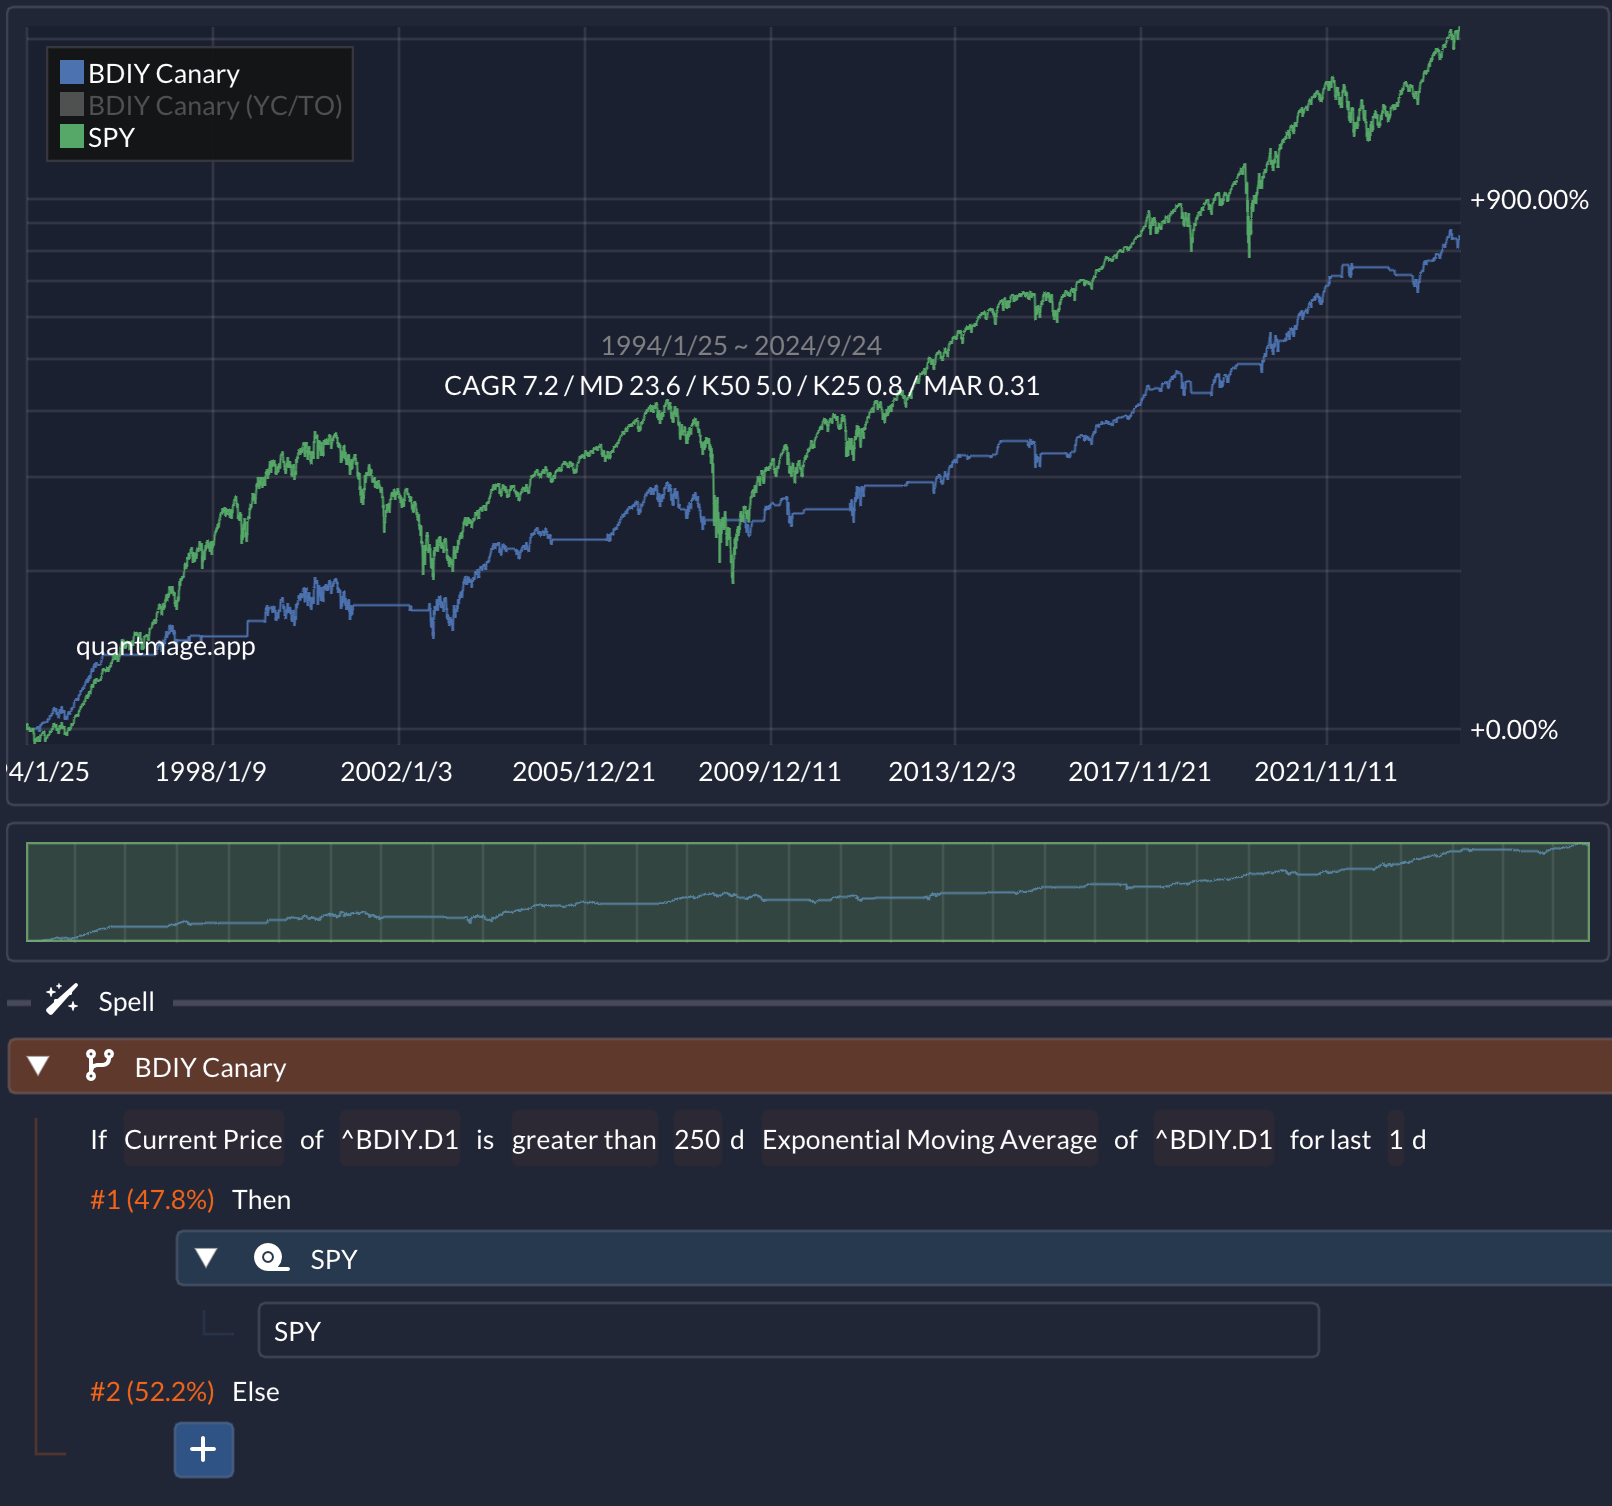
Instead of the suggested 100-day EMA, I opted for a 250-day EMA of the BDI—it showed better backtest performance. Over 30 years, this strategy yielded a 7.2% compound annual growth rate (CAGR). Sure, that’s lower than the S&P 500’s 10.5% buy-and-hold return, but here’s the kicker: the risk-adjusted returns (think Sharpe ratio and similar metrics) were superior. This strategy especially shined during the Global Financial Crisis and the COVID-19 market dips.
However, the blog pointed out a flaw: shipping costs can drop not just due to slowing demand but also because of a sudden increase in the supply of ships. To tackle this, it suggested using a trailing stop loss to avoid selling when the market trend is positive.
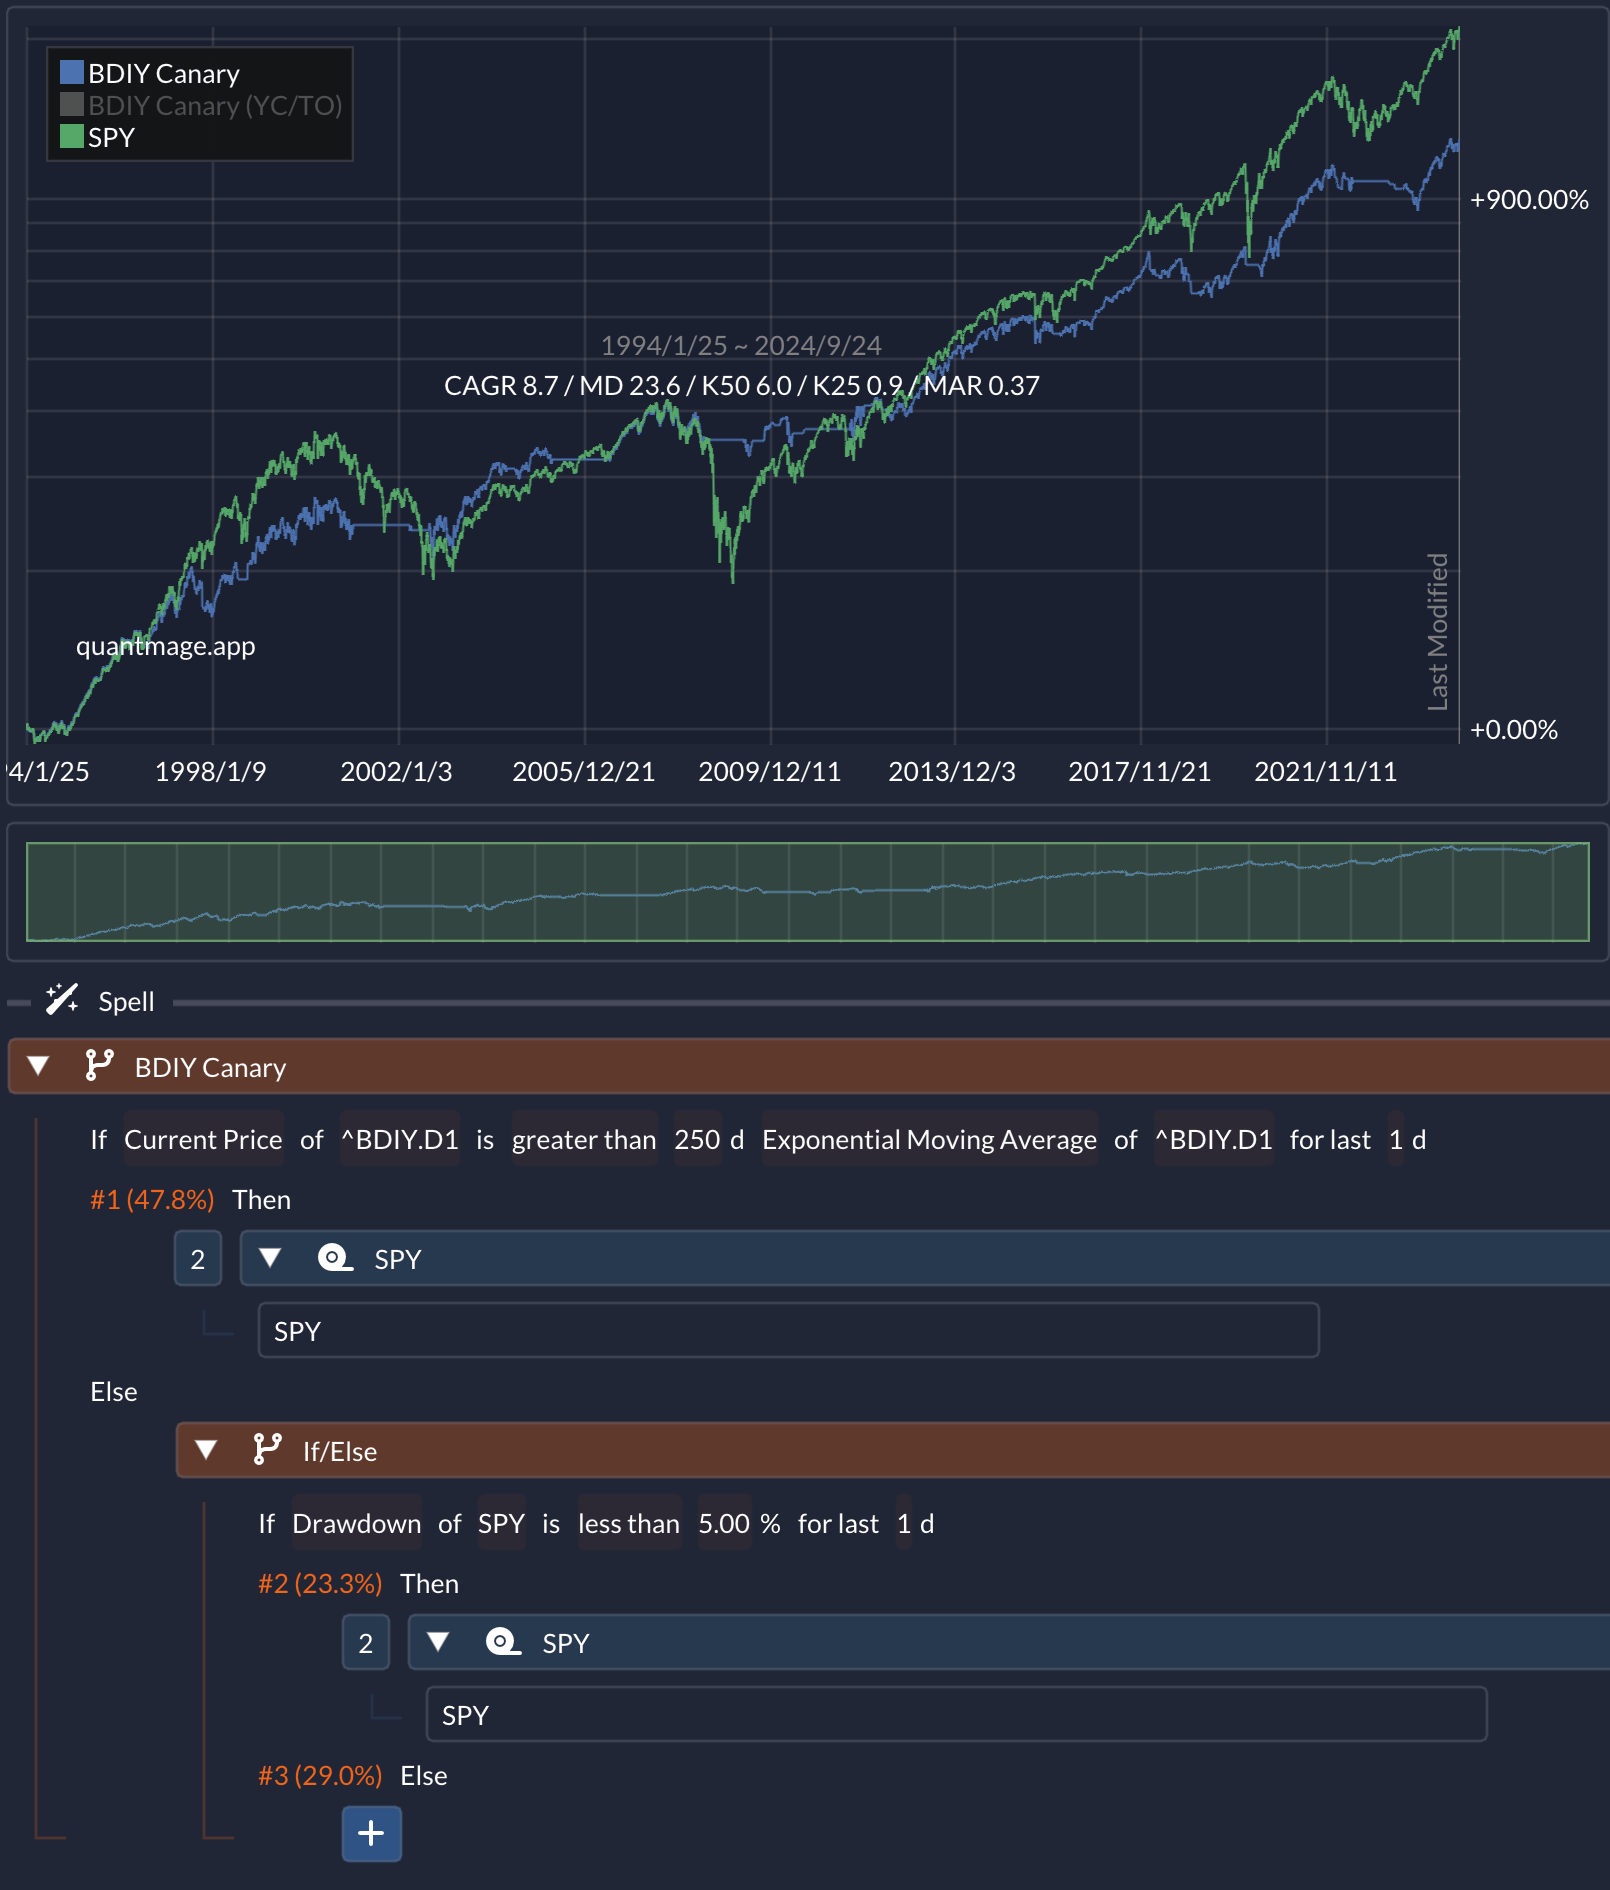
By being more in the market with a 5% trailing stop loss, the CAGR improved from 7.2% to 8.7%. Not too shabby!
3-Month Cumulative Return: Catching Short-Term Trends
Next, I explored using the 3-month growth rate of the BDI, as the research paper suggested.
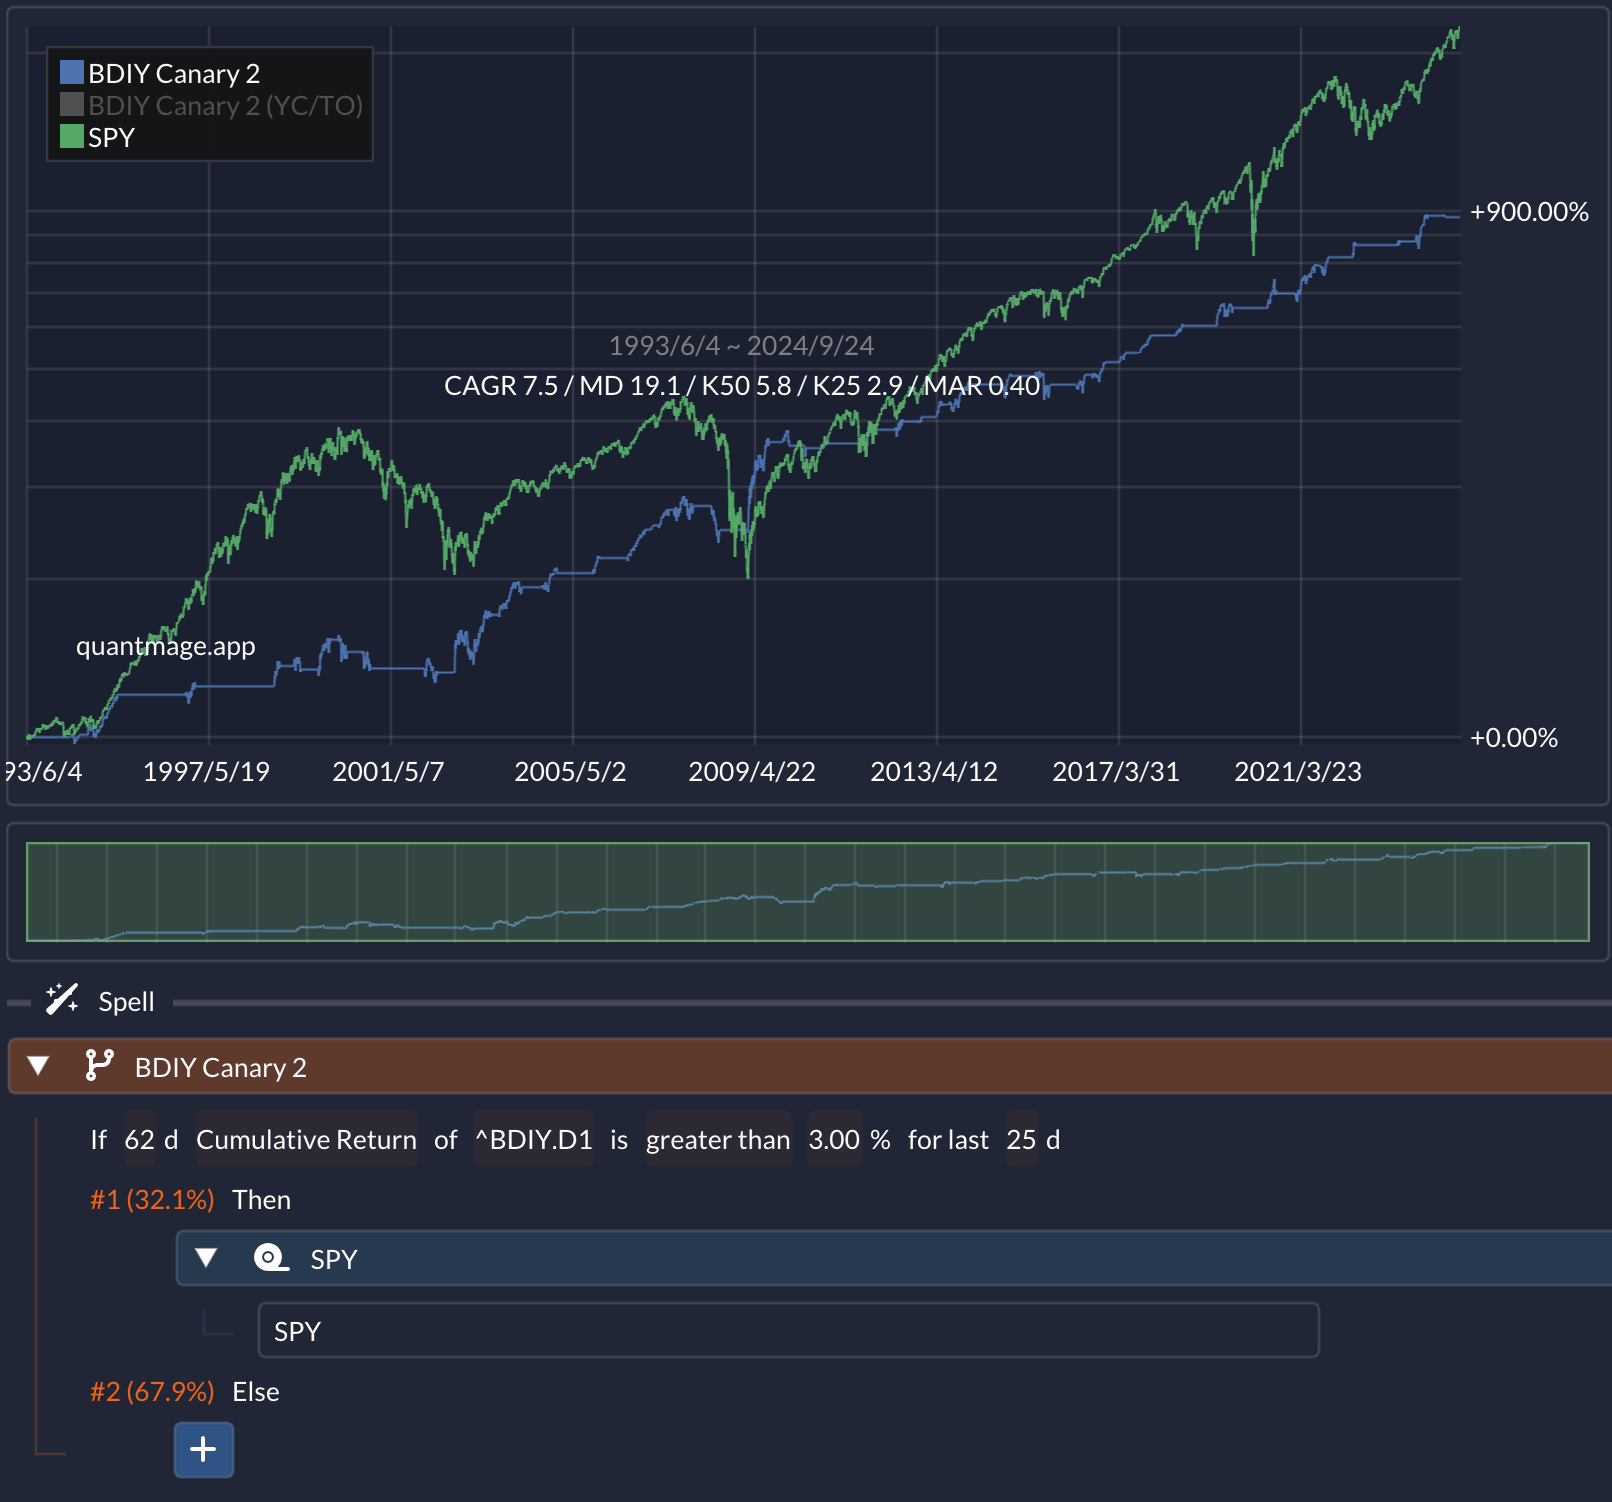
62 trading days approximate three months. Setting a threshold at a 3% growth rate delivered decent results. Adding a condition to check this over 25 consecutive days further reduced drawdowns. Over a 31-year period, this method showed comparable returns. And yes, we can sprinkle the trailing stop loss magic here too.
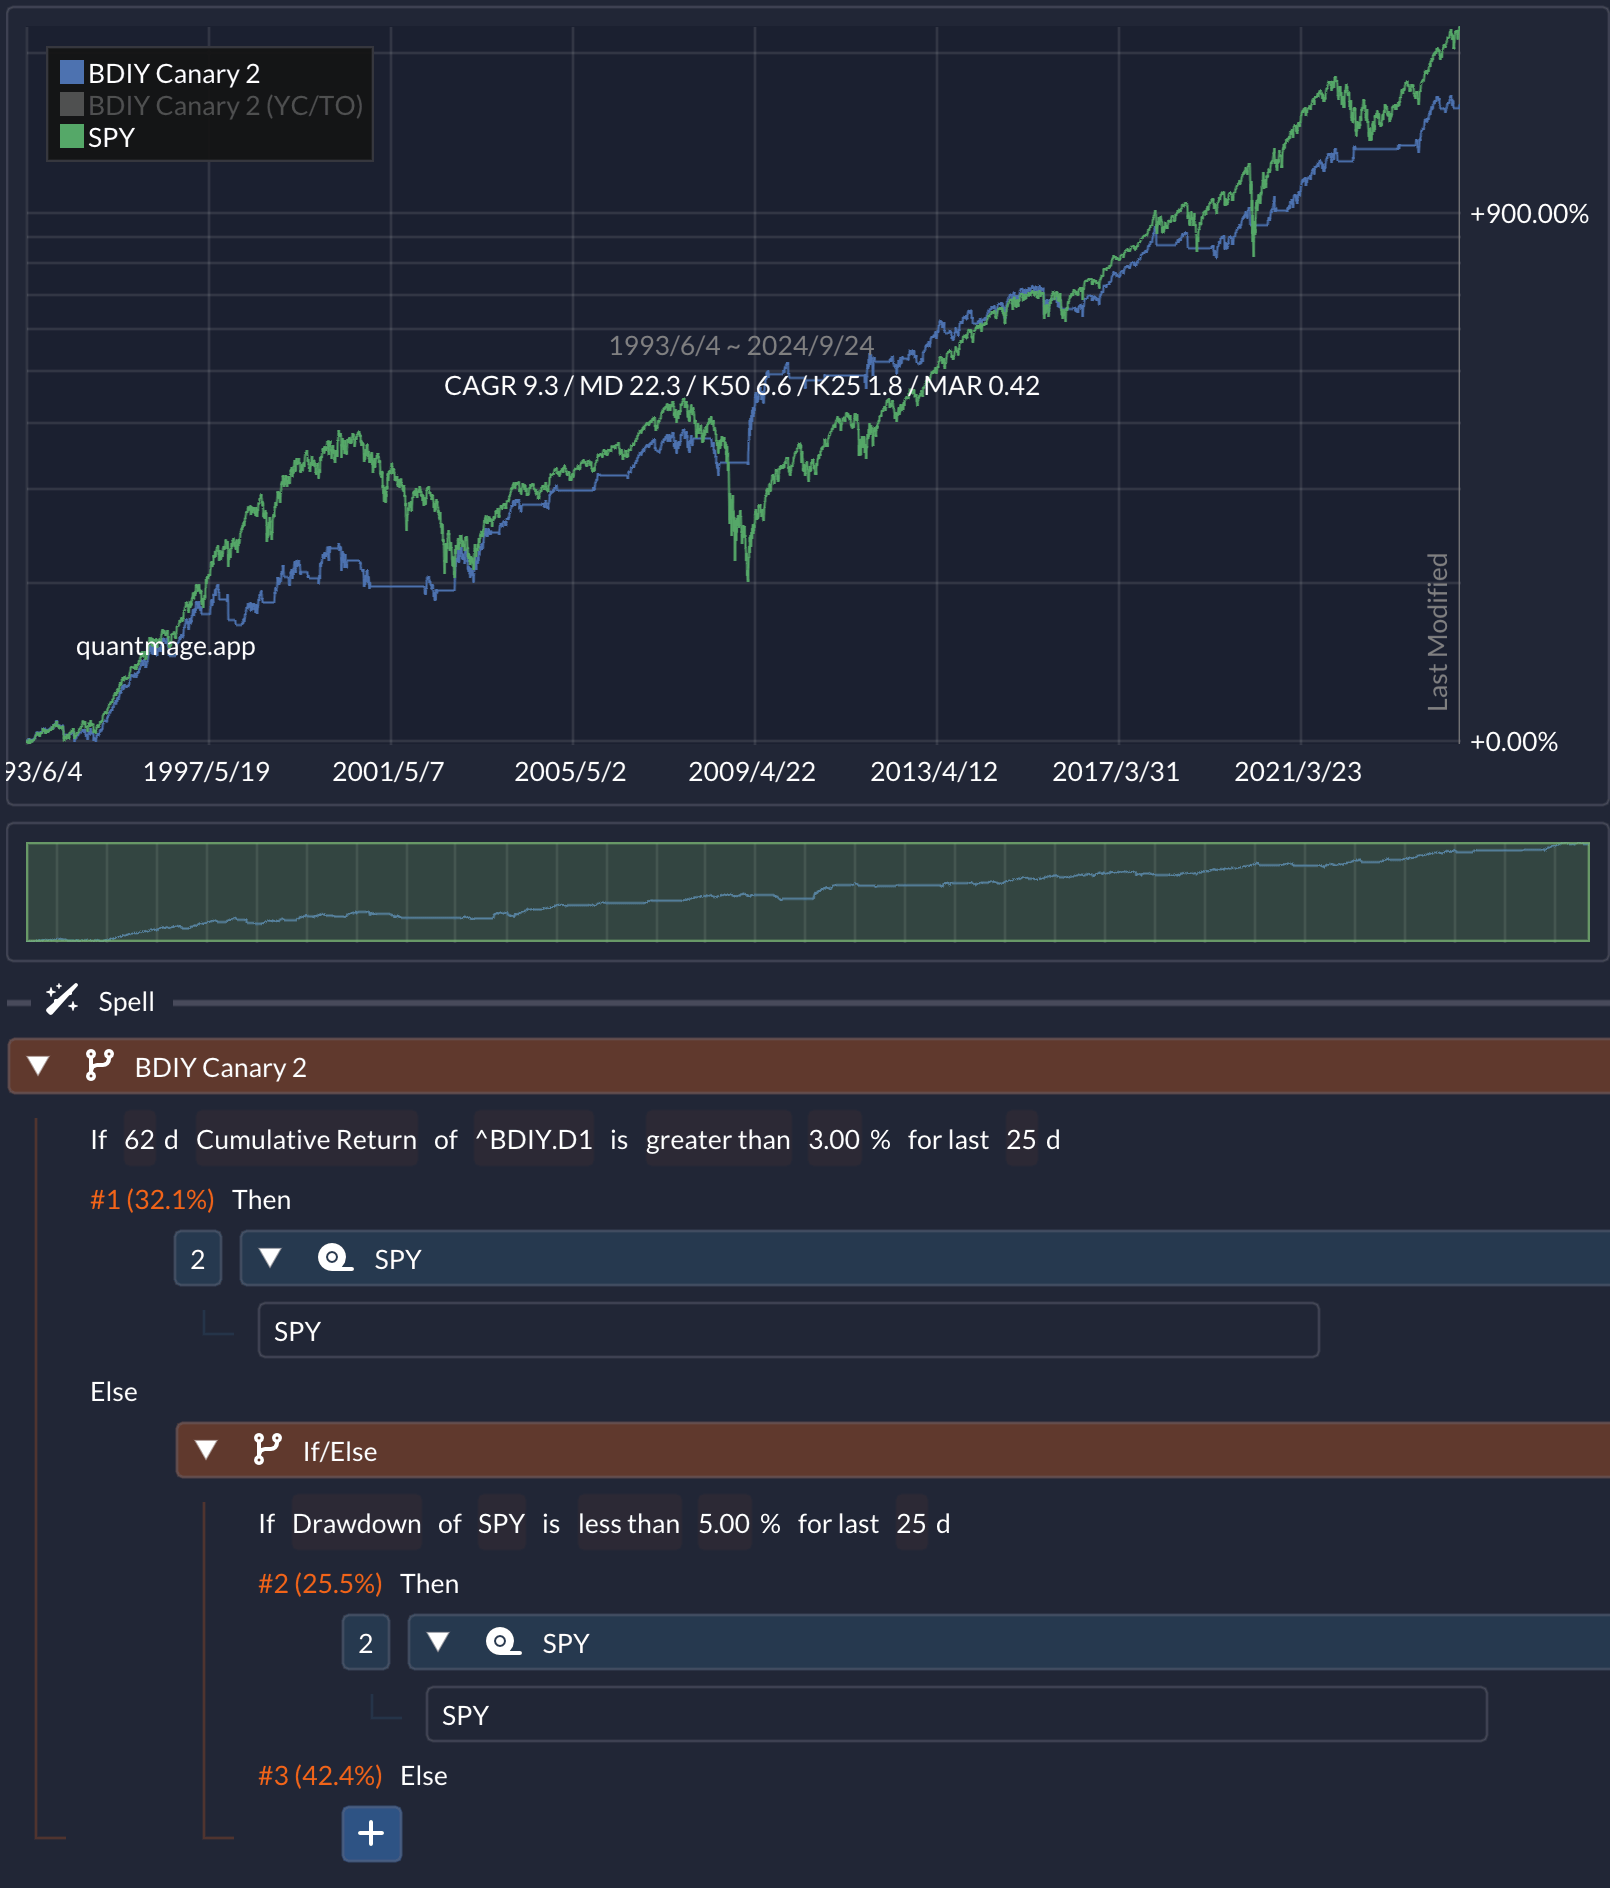
By being more conservative—checking the S&P 500’s drawdown for 25 consecutive days—we improved the risk-adjusted return even more. The return gap with the buy-and-hold strategy narrowed, boasting a 9.3% CAGR.
Combo Time: The Best of Both Worlds
Why settle for one strategy when you can combine them? I merged the EMA crossover and the 3-month cumulative return approaches, utilizing QuantMage’s handy “empty branch” trick, which can maximize time in the market.
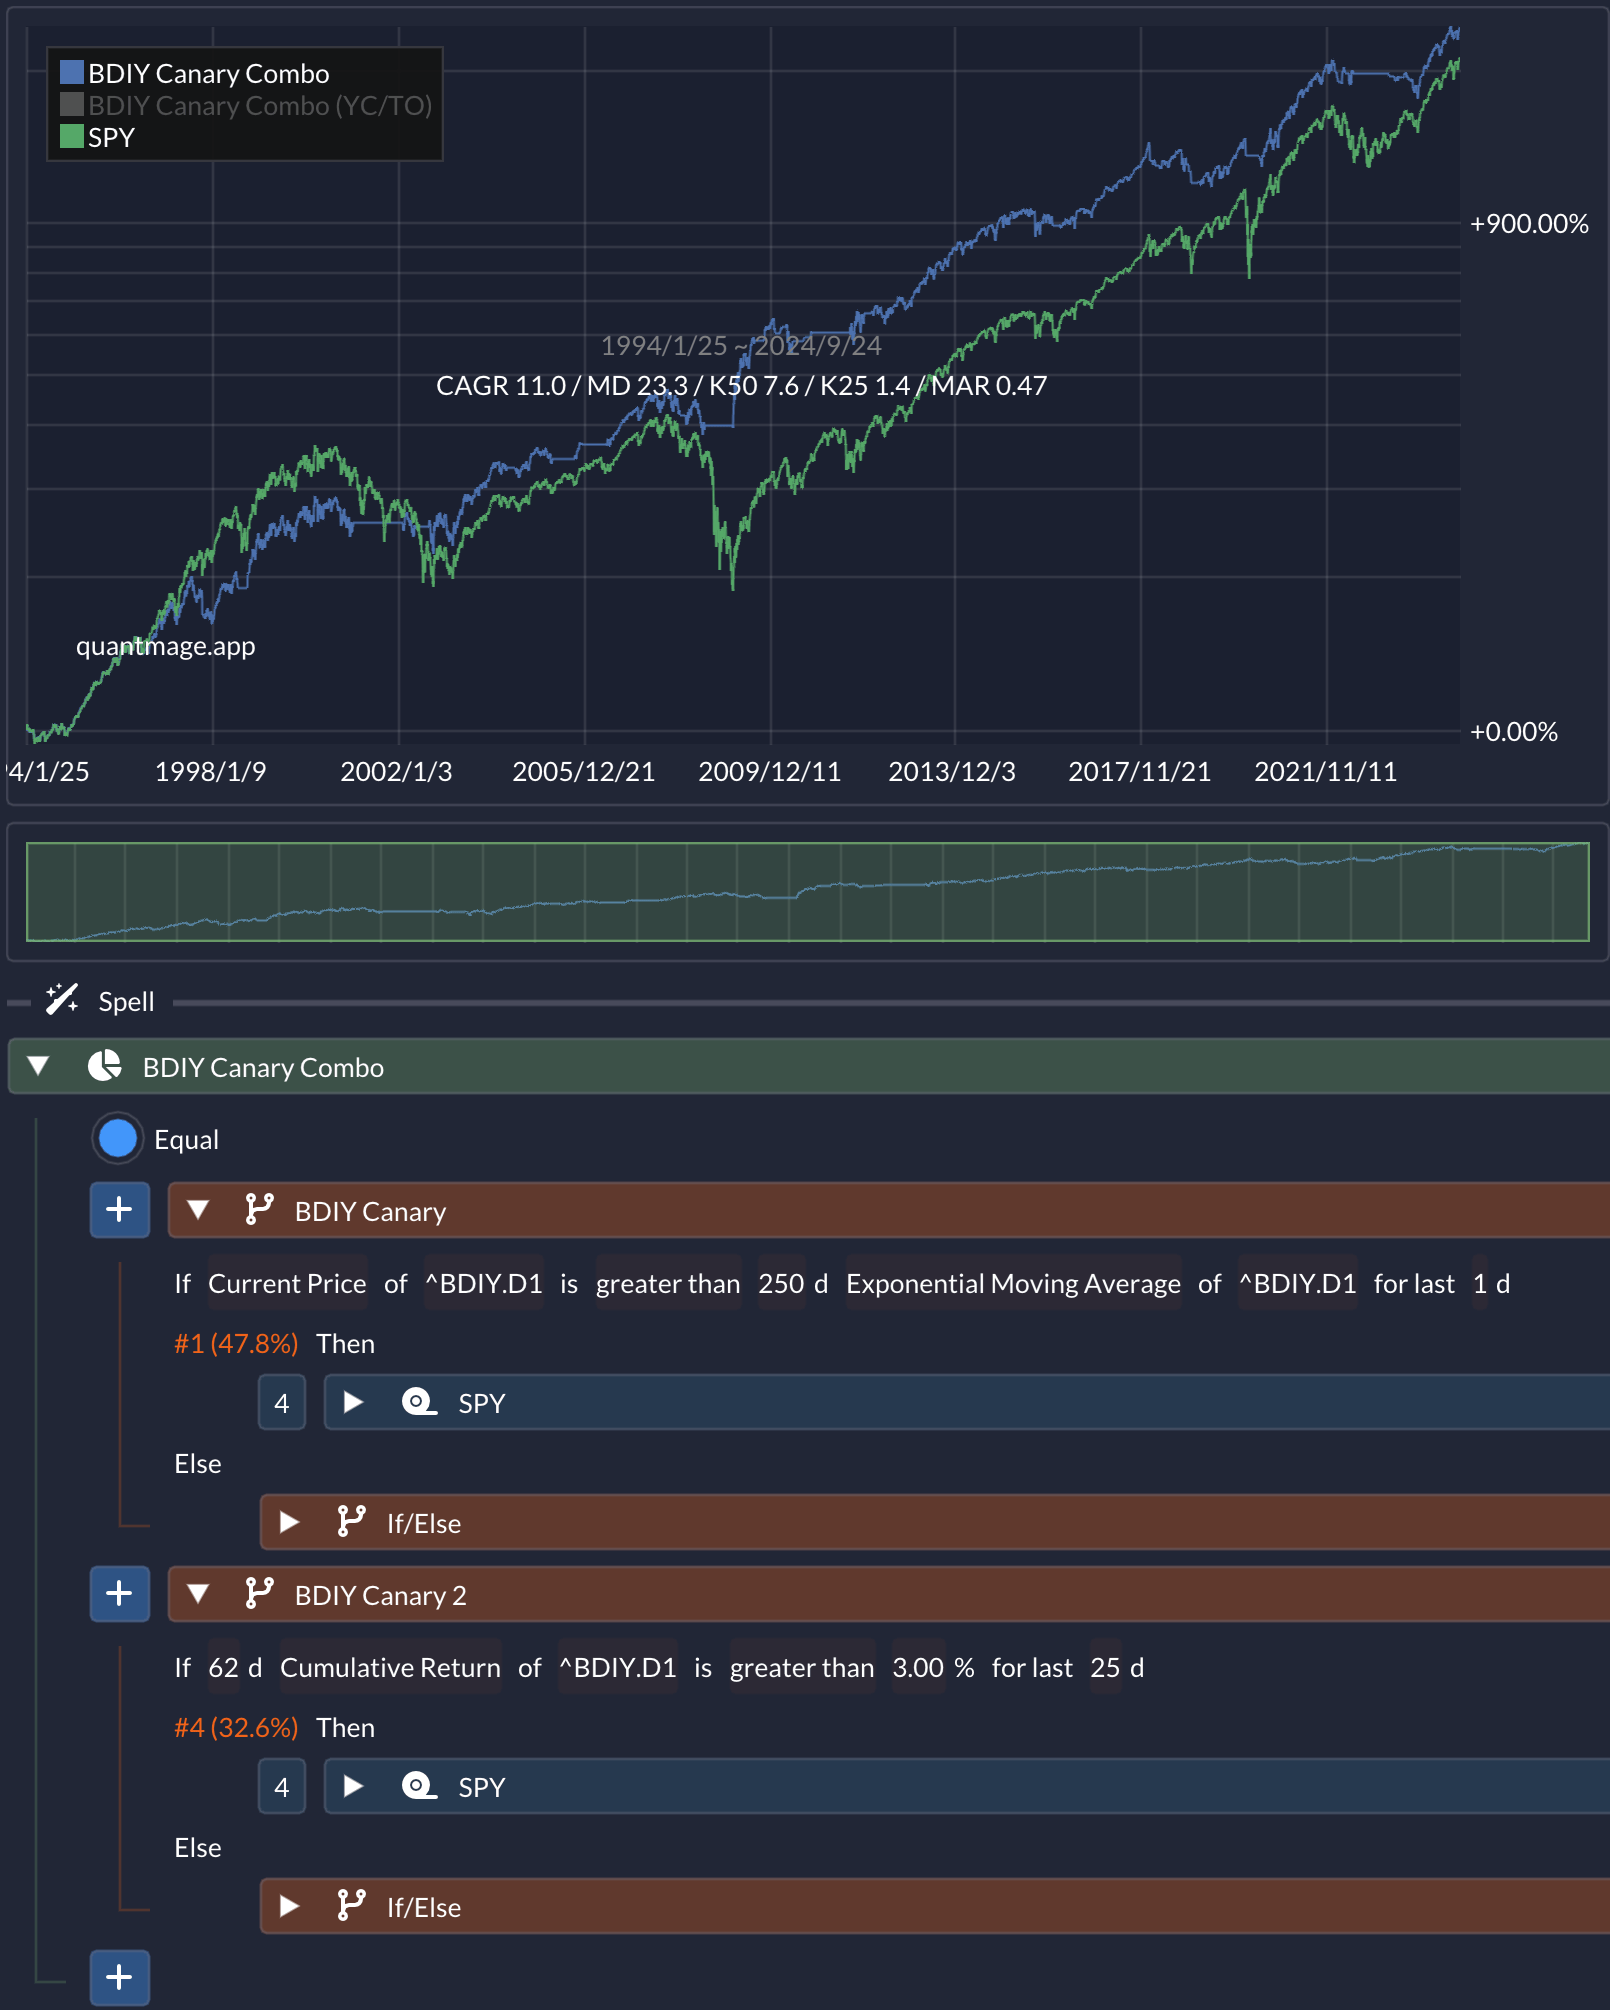
The result? An impressive 11% CAGR that not only beats the buy-and-hold strategy in risk-adjusted terms but also in absolute returns! Victory lap, anyone?
The Bottom Line
The Baltic Dry Index appears to be a potent market canary. Combining it with other indicators could make it even more powerful. But I’m curious—what do you think? Does the BDI work (and will it continue to work) as a leading indicator? Do you have different ideas on how to utilize this index? Or maybe you know of other indices that can function as market canaries?
🚨 Just a heads-up: This content is for informational purposes only. It’s not investment advice or a recommendation to buy or sell any securities. Always do your own research and consider consulting a financial professional before making any investment decisions.
I always enjoy seeing what you come up with regarding canaries!