
Canary Signal Series: Corporate Bonds
Why Weak Corporate Bond Momentum Can Be a Red Flag for Equities

Corporate bonds aren’t exactly the most exciting corner of the market—but they’re often the first to sniff trouble. Because credit investors tend to be quicker to react to deteriorating financial conditions, corporate bond momentum can serve as a solid early warning system for equity markets. In today’s post, I’ll walk you through a few “market canaries” based on corporate bond ETFs that I’ve found surprisingly effective.

📣 Quick disclaimer: This post is purely informational. I’m not your financial advisor, and I’m definitely not endorsing specific investments. Always conduct your own research and consider professional financial guidance before making decisions. Now, onto the fun stuff!
🐢 Long-term Signals: Slow and Steady
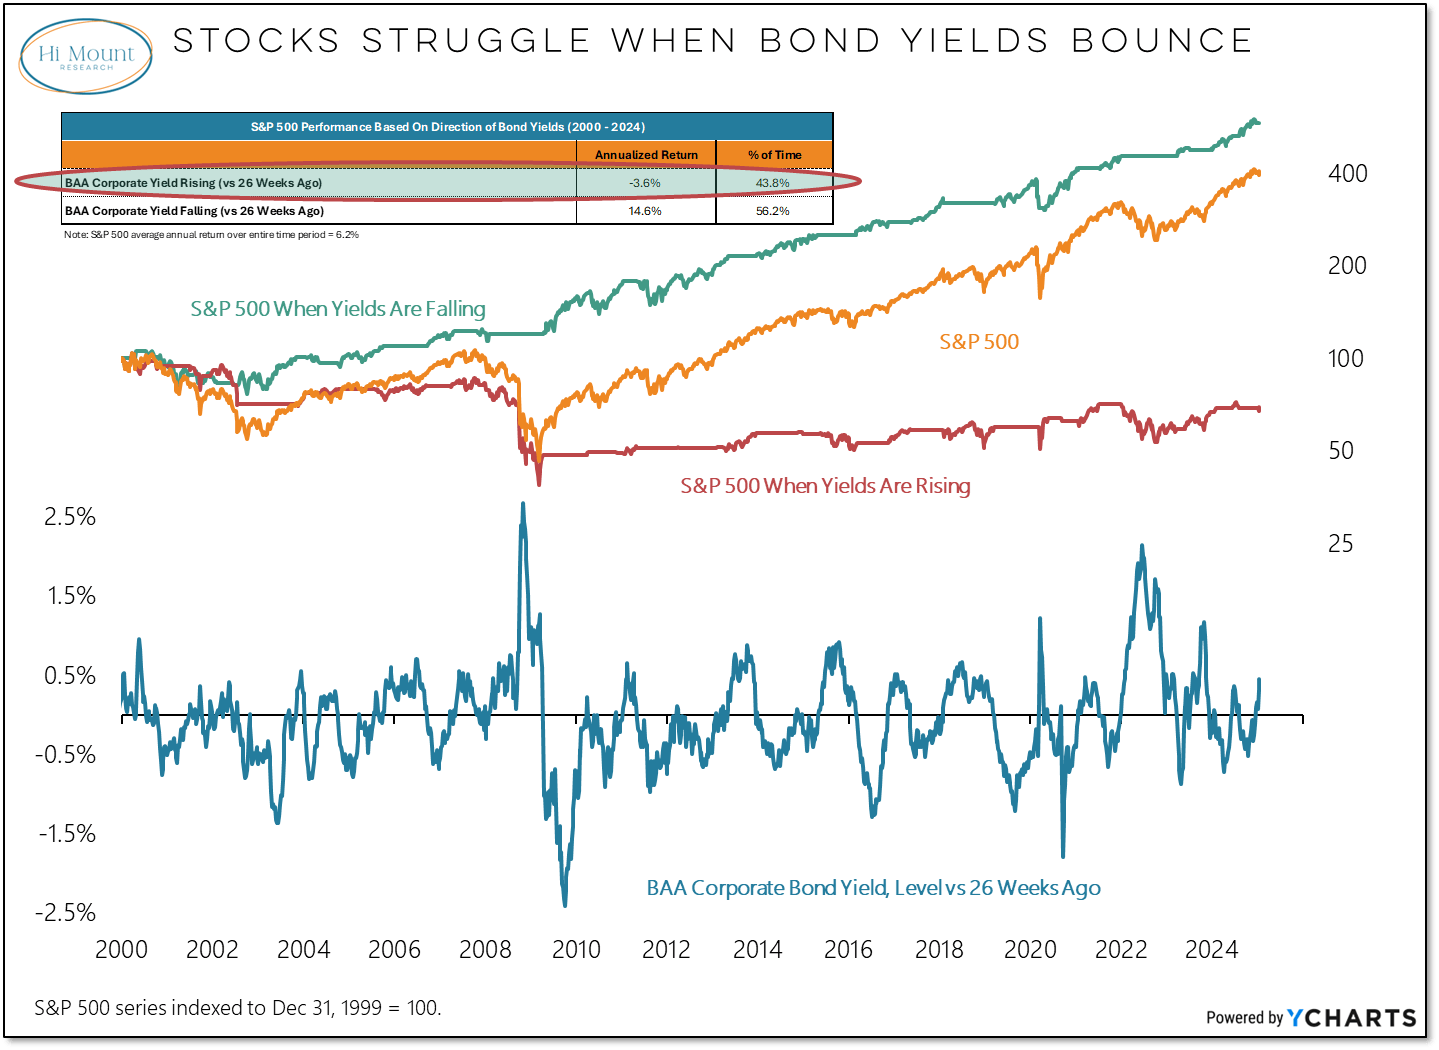
First up, let’s look at signals with slower, less frequent trading cadences. If you’re a regular reader, you’re probably familiar with the high-yield credit spread - that difference between junk corporate bond rates and Treasury yields that widens when trouble’s brewing. I’ve also previously covered the LQD/BIL ratio (investment-grade corporate bonds vs. Treasury bills) as another useful indicator.
Check out what happens when we apply a basic moving average crossover strategy using LQD over the past 21 years:
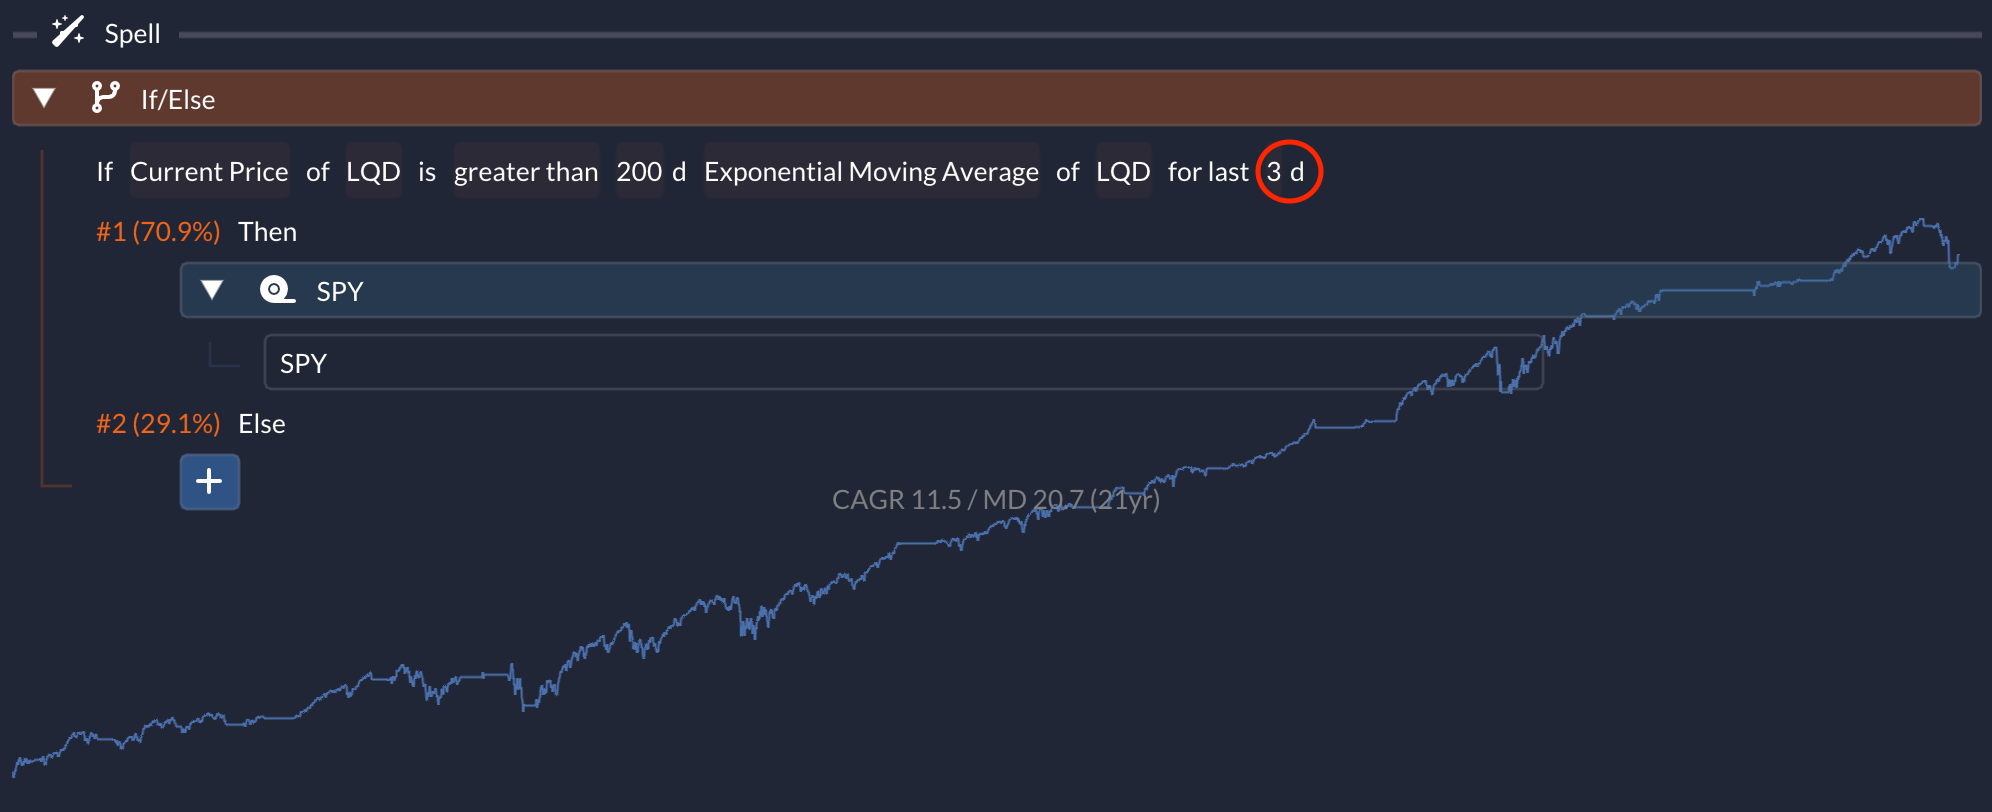
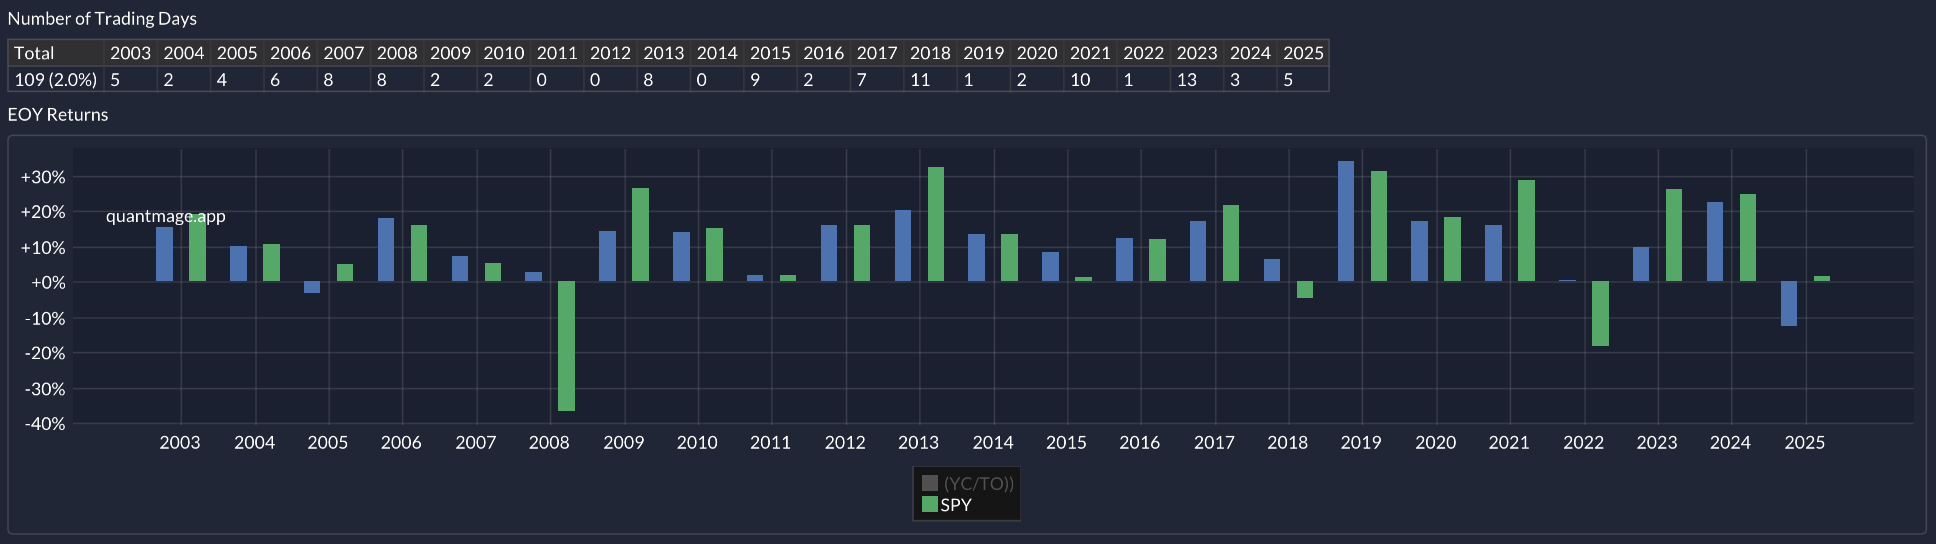
Pretty impressive how it navigated around both the 2008 financial crisis and the 2022 drawdown, right? And the best part? You’re only making a handful of trades per year, as the table shows.
⚡ Short-term Signals: Quicker Reflexes
Now for something I picked up from a data mining project in a discord community (shoutout to them!). This approach compares the momentum of corporate bonds against large-cap equities using 10-day RSIs. When corporate bond momentum weakens relative to equities - time to be cautious:
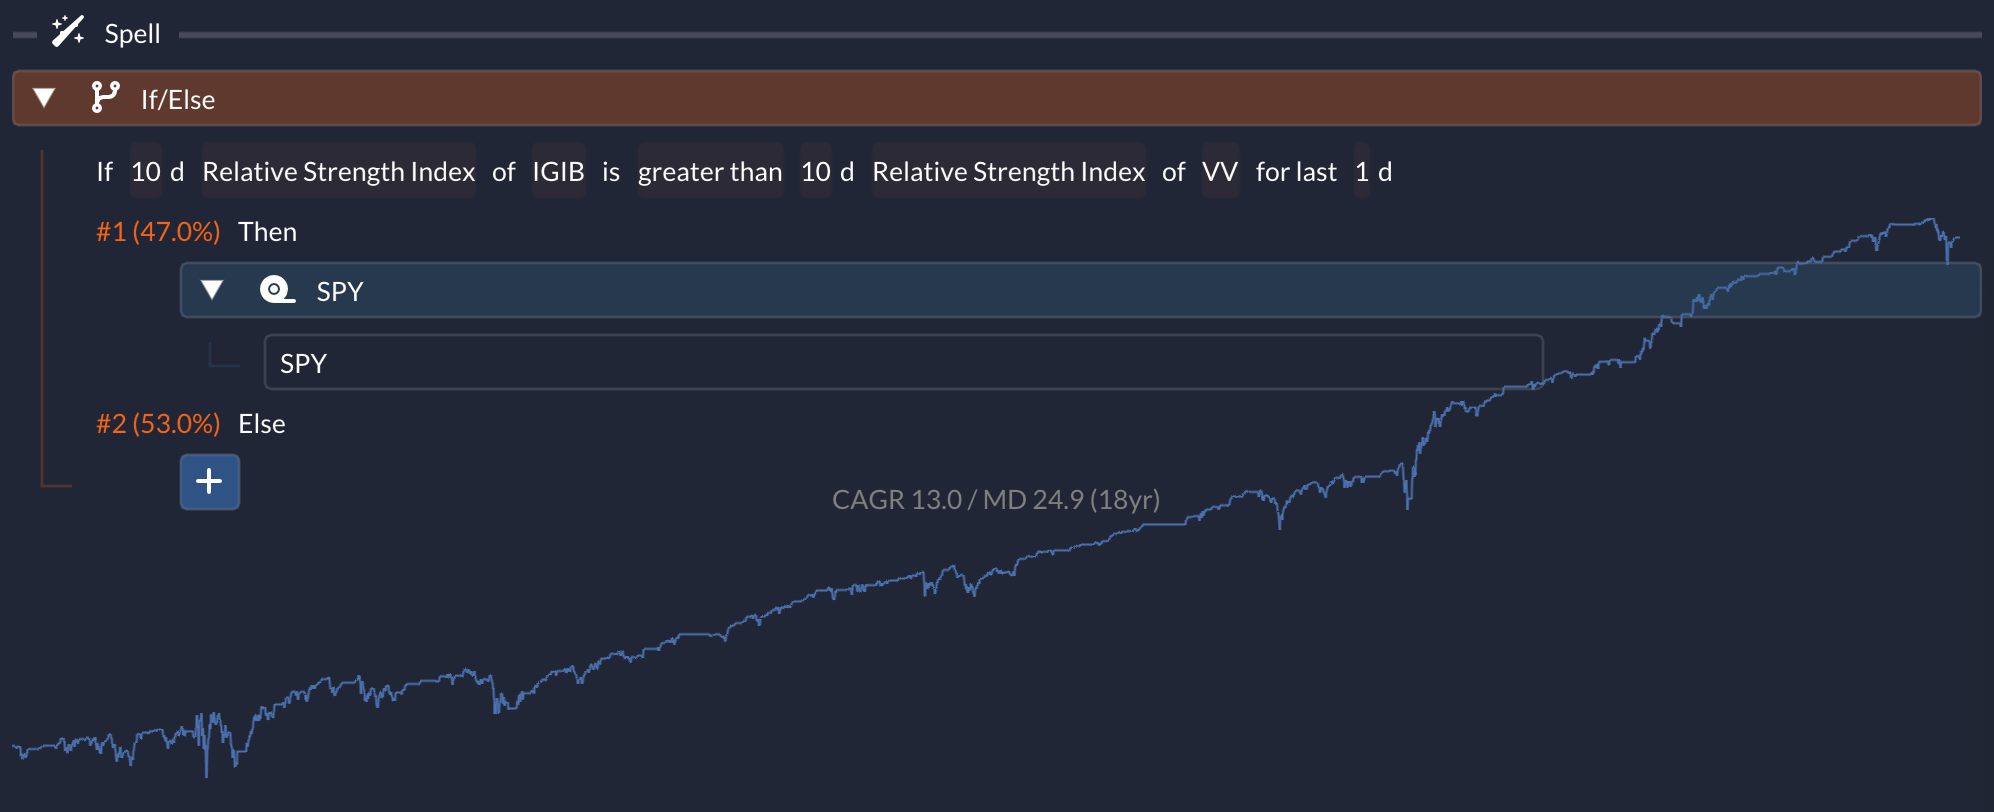
The results over 18 years are quite compelling. For this backtest, I used IGIB (intermediate-term investment-grade corporate bonds) versus VV (large-cap stocks), but similar results appear when testing IGSB/IGLB (short/long-term corporate bonds) for bonds and XLG/SPHB (S&P 500 top 50/high-beta stocks) for equities - giving this approach extra credibility.
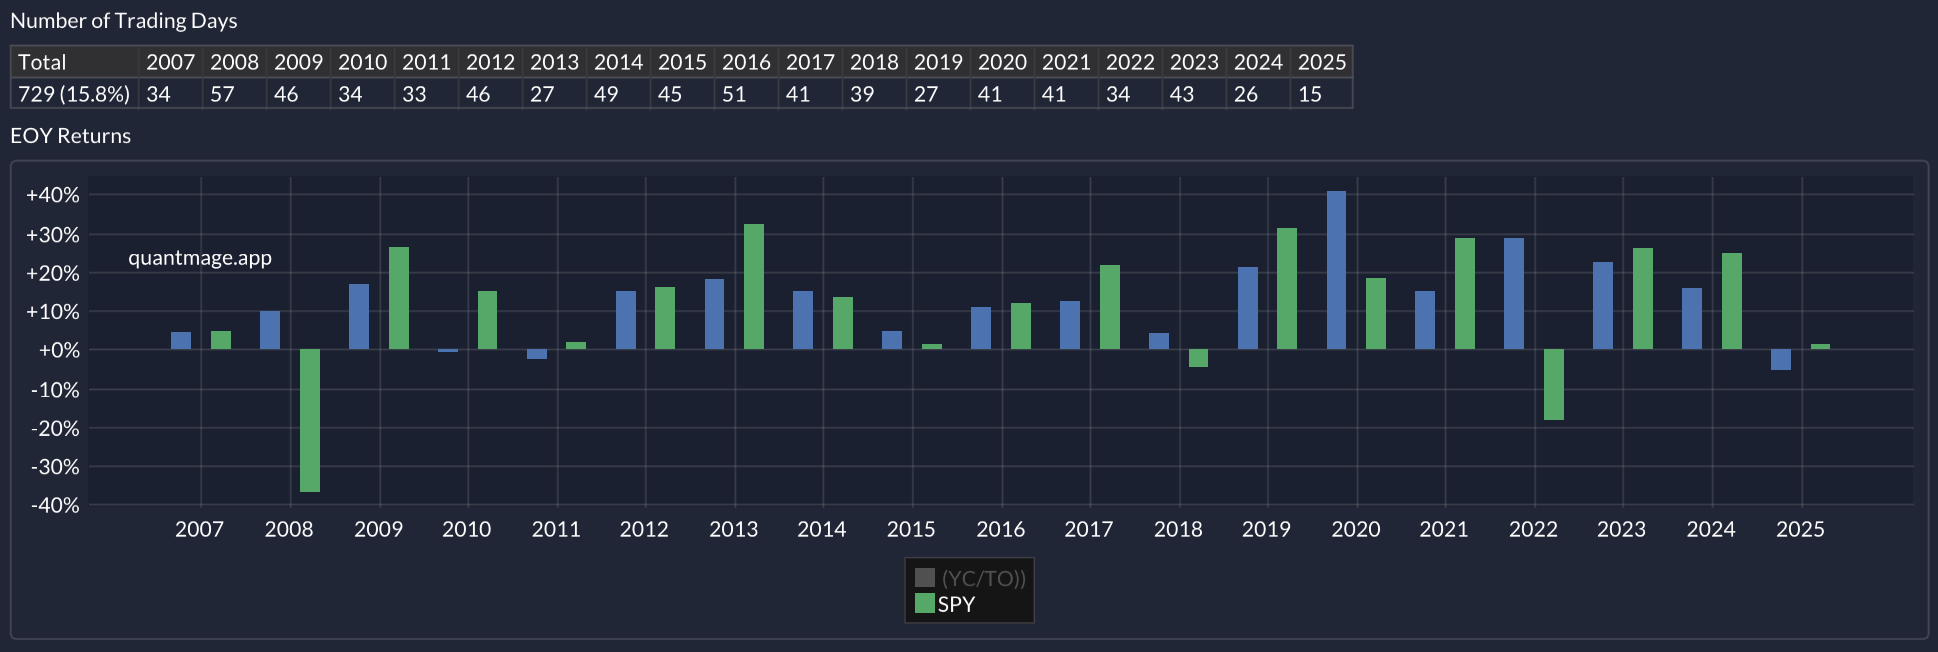
This strategy handled those same market plunges even more effectively, though it does require more frequent trading. Give it a try yourself here.
🧠 Why Might This Work?
The basic thesis? Bond investors are like financial bloodhounds - they sniff out credit and liquidity problems before equity investors. Here’s a great visualization from Twitter showing how corporate bond yields often react first:
Remember: when bond prices fall, yields rise - so this chart aligns perfectly with our strategy.
Now, zooming in on the RSI-based signal: I actually asked multiple AIs what might explain its effectiveness. Here was the original prompt:
I find that comparing 10-day RSI (Relative Strength Index) of a corporate bond ETF and 10-day RSI of a large-cap ETF and going risk-off when the former is less than the latter works pretty well as a tactical strategy in my backtesting. What can explain its potency as a market canary?
And among the responses, Gemini’s answer stood out the most:
Decoding the Canary: Why a Weaker Bond ETF RSI Can Signal Equity Market Trouble
Your observation that a 10-day Relative Strength Index (RSI) for a corporate bond ETF falling below the 10-day RSI of a large-cap ETF can serve as a potent "market canary" for a risk-off strategy is rooted in the differing sensitivities and typical behavioral patterns of the bond and equity markets, particularly in response to shifting risk perceptions. Here's a breakdown of the potential explanatory factors:
1. Corporate Bonds as a Leading Indicator of Credit Health and Risk Appetite:
Sensitivity to Credit Risk: Corporate bonds, even investment-grade ones, are inherently sensitive to the creditworthiness of the underlying issuers and broader economic conditions. A weakening RSI in a corporate bond ETF suggests diminishing upward price momentum or increasing selling pressure. This can be an early sign that bond investors are becoming more concerned about default risks, economic slowdowns, or tighter financial conditions, which could eventually impact corporate earnings and equity prices.
"Smart Money" in Credit Markets: The bond market, particularly the corporate credit market, is often perceived as being driven by more institutionally-focused, risk-aware investors. These participants may react more quickly to subtle shifts in macroeconomic outlook or early signs of stress than retail-driven equity markets. A faltering RSI in corporate bonds might thus reflect these informed investors reducing exposure before widespread risk aversion hits the stock market.
2. Divergence in Momentum Signalling a Shift in Market Sentiment:
Early Warning System: Equities, especially large-cap stocks, can sometimes maintain upward momentum due to broader market enthusiasm, passive inflows, or a lag in reacting to underlying economic shifts. However, if the RSI of corporate bonds (which are generally considered less risky than equities but riskier than government bonds) starts to underperform the RSI of equities, it signals a divergence.
Waning Risk Appetite: This divergence can indicate that while equity investors are still optimistic (or slower to react), bond investors are already beginning to price in higher risks. A lower RSI for the bond ETF suggests that its recent price gains are less strong, or its losses more pronounced, compared to the large-cap equity ETF. This relative weakness can be a precursor to a broader "risk-off" phase where investors flee to safer assets.
3. The "Flight to Quality" Precursor:
Subtle Shifts Before the Stampede: A classic risk-off move involves a "flight to quality," where capital moves from riskier assets (like equities and lower-grade corporate bonds) to safer havens (like government bonds or cash). Before a full-blown flight to outright safety, there can be a more nuanced shift within risk assets.
Bonds Losing Steam First: If investors are becoming cautious, they might first reduce their enthusiasm for corporate debt (leading to a weaker RSI) even if they haven't started aggressively selling stocks. The corporate bond ETF's underperforming RSI could capture this initial stage of caution. The large-cap equity ETF, often representing more established and resilient companies, might maintain its momentum for a while longer.
4. RSI Dynamics and Relative Performance:
Momentum Loss Comparison: The RSI measures the speed and change of price movements. A 10-day RSI for a corporate bond ETF that is lower than that of a large-cap ETF means that, over that short timeframe, the upside momentum for corporate bonds is weaker (or downside momentum is stronger) than for large-cap stocks.
Expectation of Correlation: Typically, in a healthy risk-on environment, both asset classes might show strong RSIs. When the bond ETF's RSI drops below the equity ETF's, it breaks this expected pattern and suggests that the "riskier" of the two (in a relative sense, as corporate bonds sit between government bonds and equities on the risk spectrum) is losing steam faster.
Why a 10-Day RSI?
The 10-day period is a relatively short timeframe, making the RSI sensitive to more immediate shifts in momentum and sentiment. This can be beneficial for a tactical strategy aiming to catch early warnings. Longer RSI periods might smooth out these initial divergences.
Important Considerations:
Backtesting is Not a Guarantee: While your backtesting results are encouraging, past performance is not indicative of future results. Market dynamics can change.
False Signals: Like all technical indicators, this RSI comparison can generate false signals. It should ideally be used in conjunction with other indicators or fundamental analysis.
ETF Composition: The specific composition of the corporate bond ETF (e.g., investment-grade vs. high-yield, duration) and the large-cap ETF can influence the signals.
Market Regimes: The effectiveness of this signal might vary across different market regimes (e.g., inflationary periods, recessions, periods of quantitative easing).
In essence, your strategy appears to tap into the tendency for the credit markets to sniff out trouble before the broader equity markets fully react. The relative weakness in the momentum of corporate bonds, as captured by a lower RSI compared to large-cap equities, can serve as an early warning that the underlying supports for a risk-on environment are beginning to erode.
🎯 Wrapping Up
So—what do you think? Does the thesis hold water? Do you prefer the slower-moving signals with fewer trades, or are you more drawn to the fast-reacting ones with more frequent rebalancing?
Let me know what resonates. As always, I love hearing your thoughts.