
Bitcoin as a Signal and Bitcoin as an Asset
Bitcoin as a Stock Signal and Semiconductors as a Bitcoin Signal

Ever feel like Bitcoin has some spooky predictive powers over the stock market? A fellow named Martin seems to think it might—and the backtest he shared is fascinating. In today’s post, we’re diving into two strategies that treat Bitcoin as a market signal and semiconductors as a Bitcoin signal. Grab some popcorn (or coffee) and let’s explore.

Bitcoin as a Stock Signal
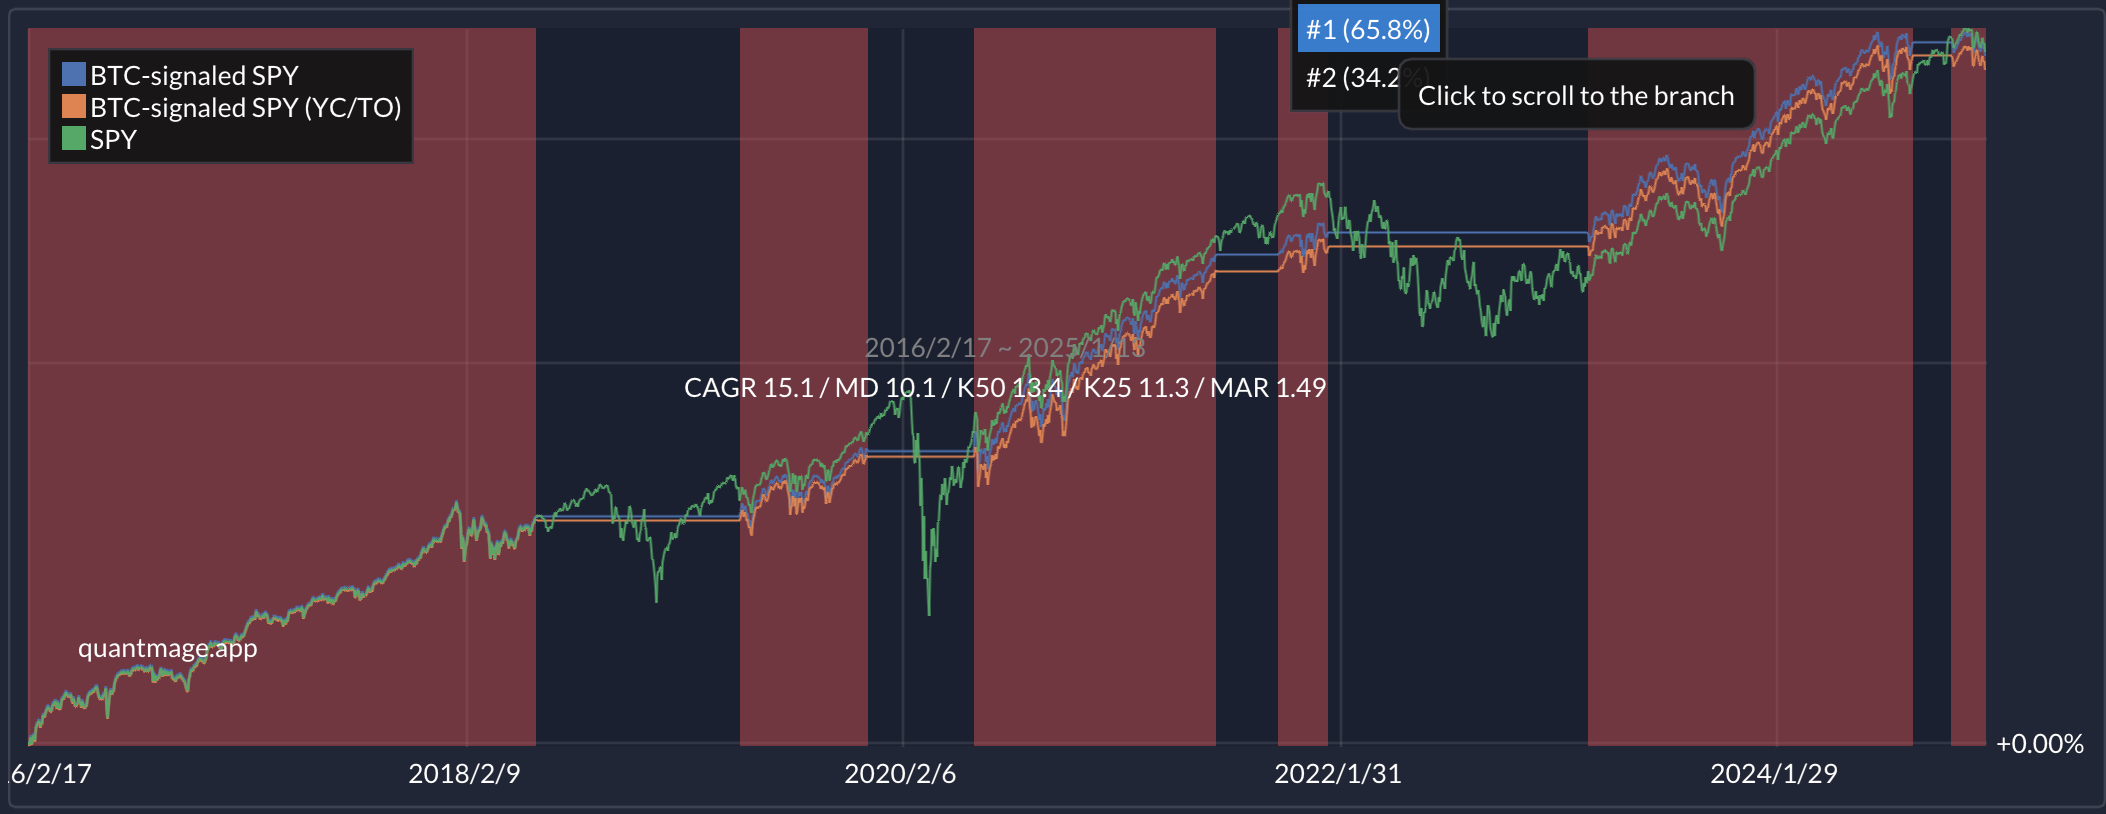
Martin’s original strategy goes “risk-on” by buying SPY whenever Bitcoin’s price floats above its 200-day moving average. I wanted to see how that might look in QuantMage, so I swapped in GBTC as a stand-in for Bitcoin (noting that GBTC used to deviate from BTC’s net asset value before it converted to an ETF last year). Also, I ended up comparing GBTC’s 50-day exponential moving average to its 200-day simple moving average for the crossover trigger:
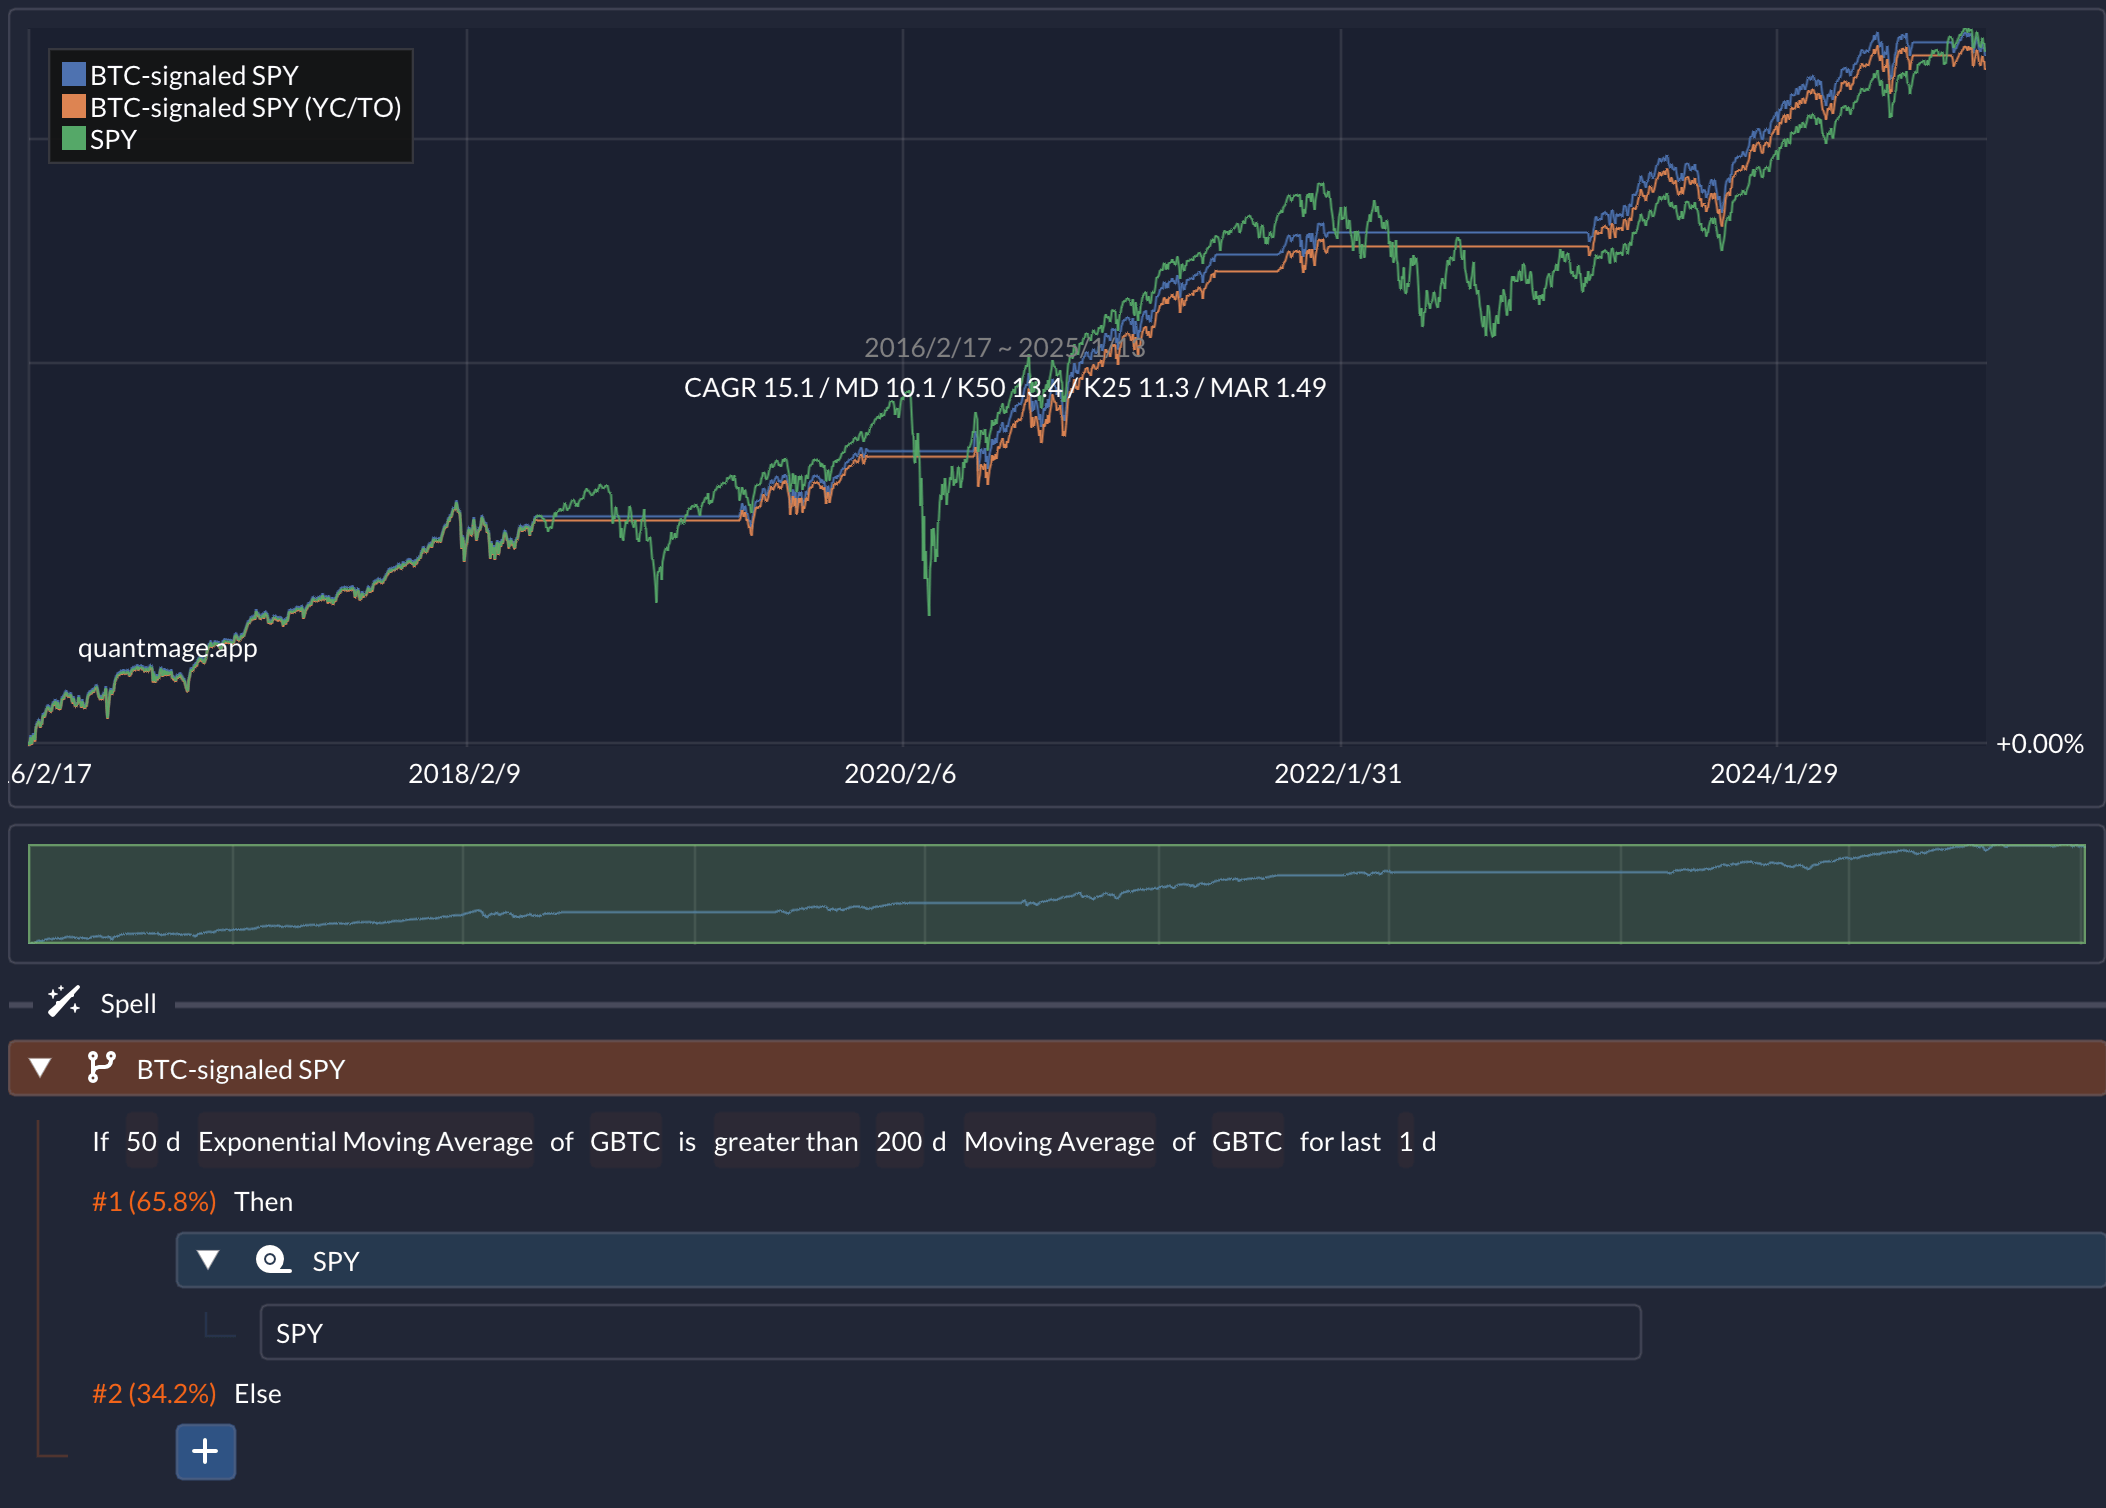
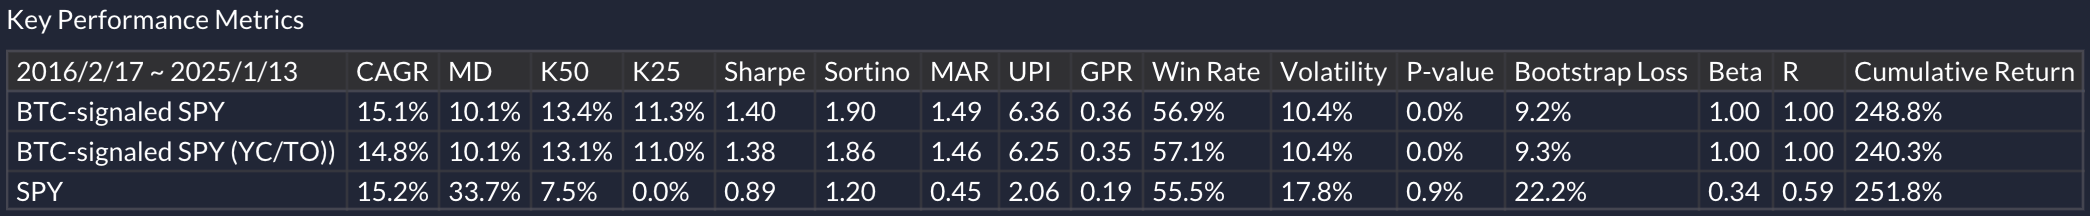
The results are impressive. The strategy elegantly sidesteps the COVID-19 crash and the 2022 drawdown. It yields an annual return of 15.1%, right on par with SPY’s buy-and-hold returns of 15.2%, but with a significantly lower max drawdown (10.1% vs. 33.7%) and volatility (10.4% vs. 17.8%)—all while being in the market just 65.8% of the time.
Why might Bitcoin act as a leading indicator for stocks?
One possible explanation comes from Lyn Alden, who highlights how Bitcoin appears to have one of the highest correlations with global liquidity. When global liquidity swells, risk assets across the board tend to benefit, and if Bitcoin is the first to react, it could potentially “warn” us about big flows into equities.
Semiconductors as a Bitcoin Signal
Next up is a twist: using GBTC as the actual asset while looking at a semiconductor ETF as the signal. Specifically, I used a Mixed incantation with a Trend Clarity indicator to scale in and out of GBTC, and STIP (a short-term inflation-protected bonds ETF) serves as the safe haven.
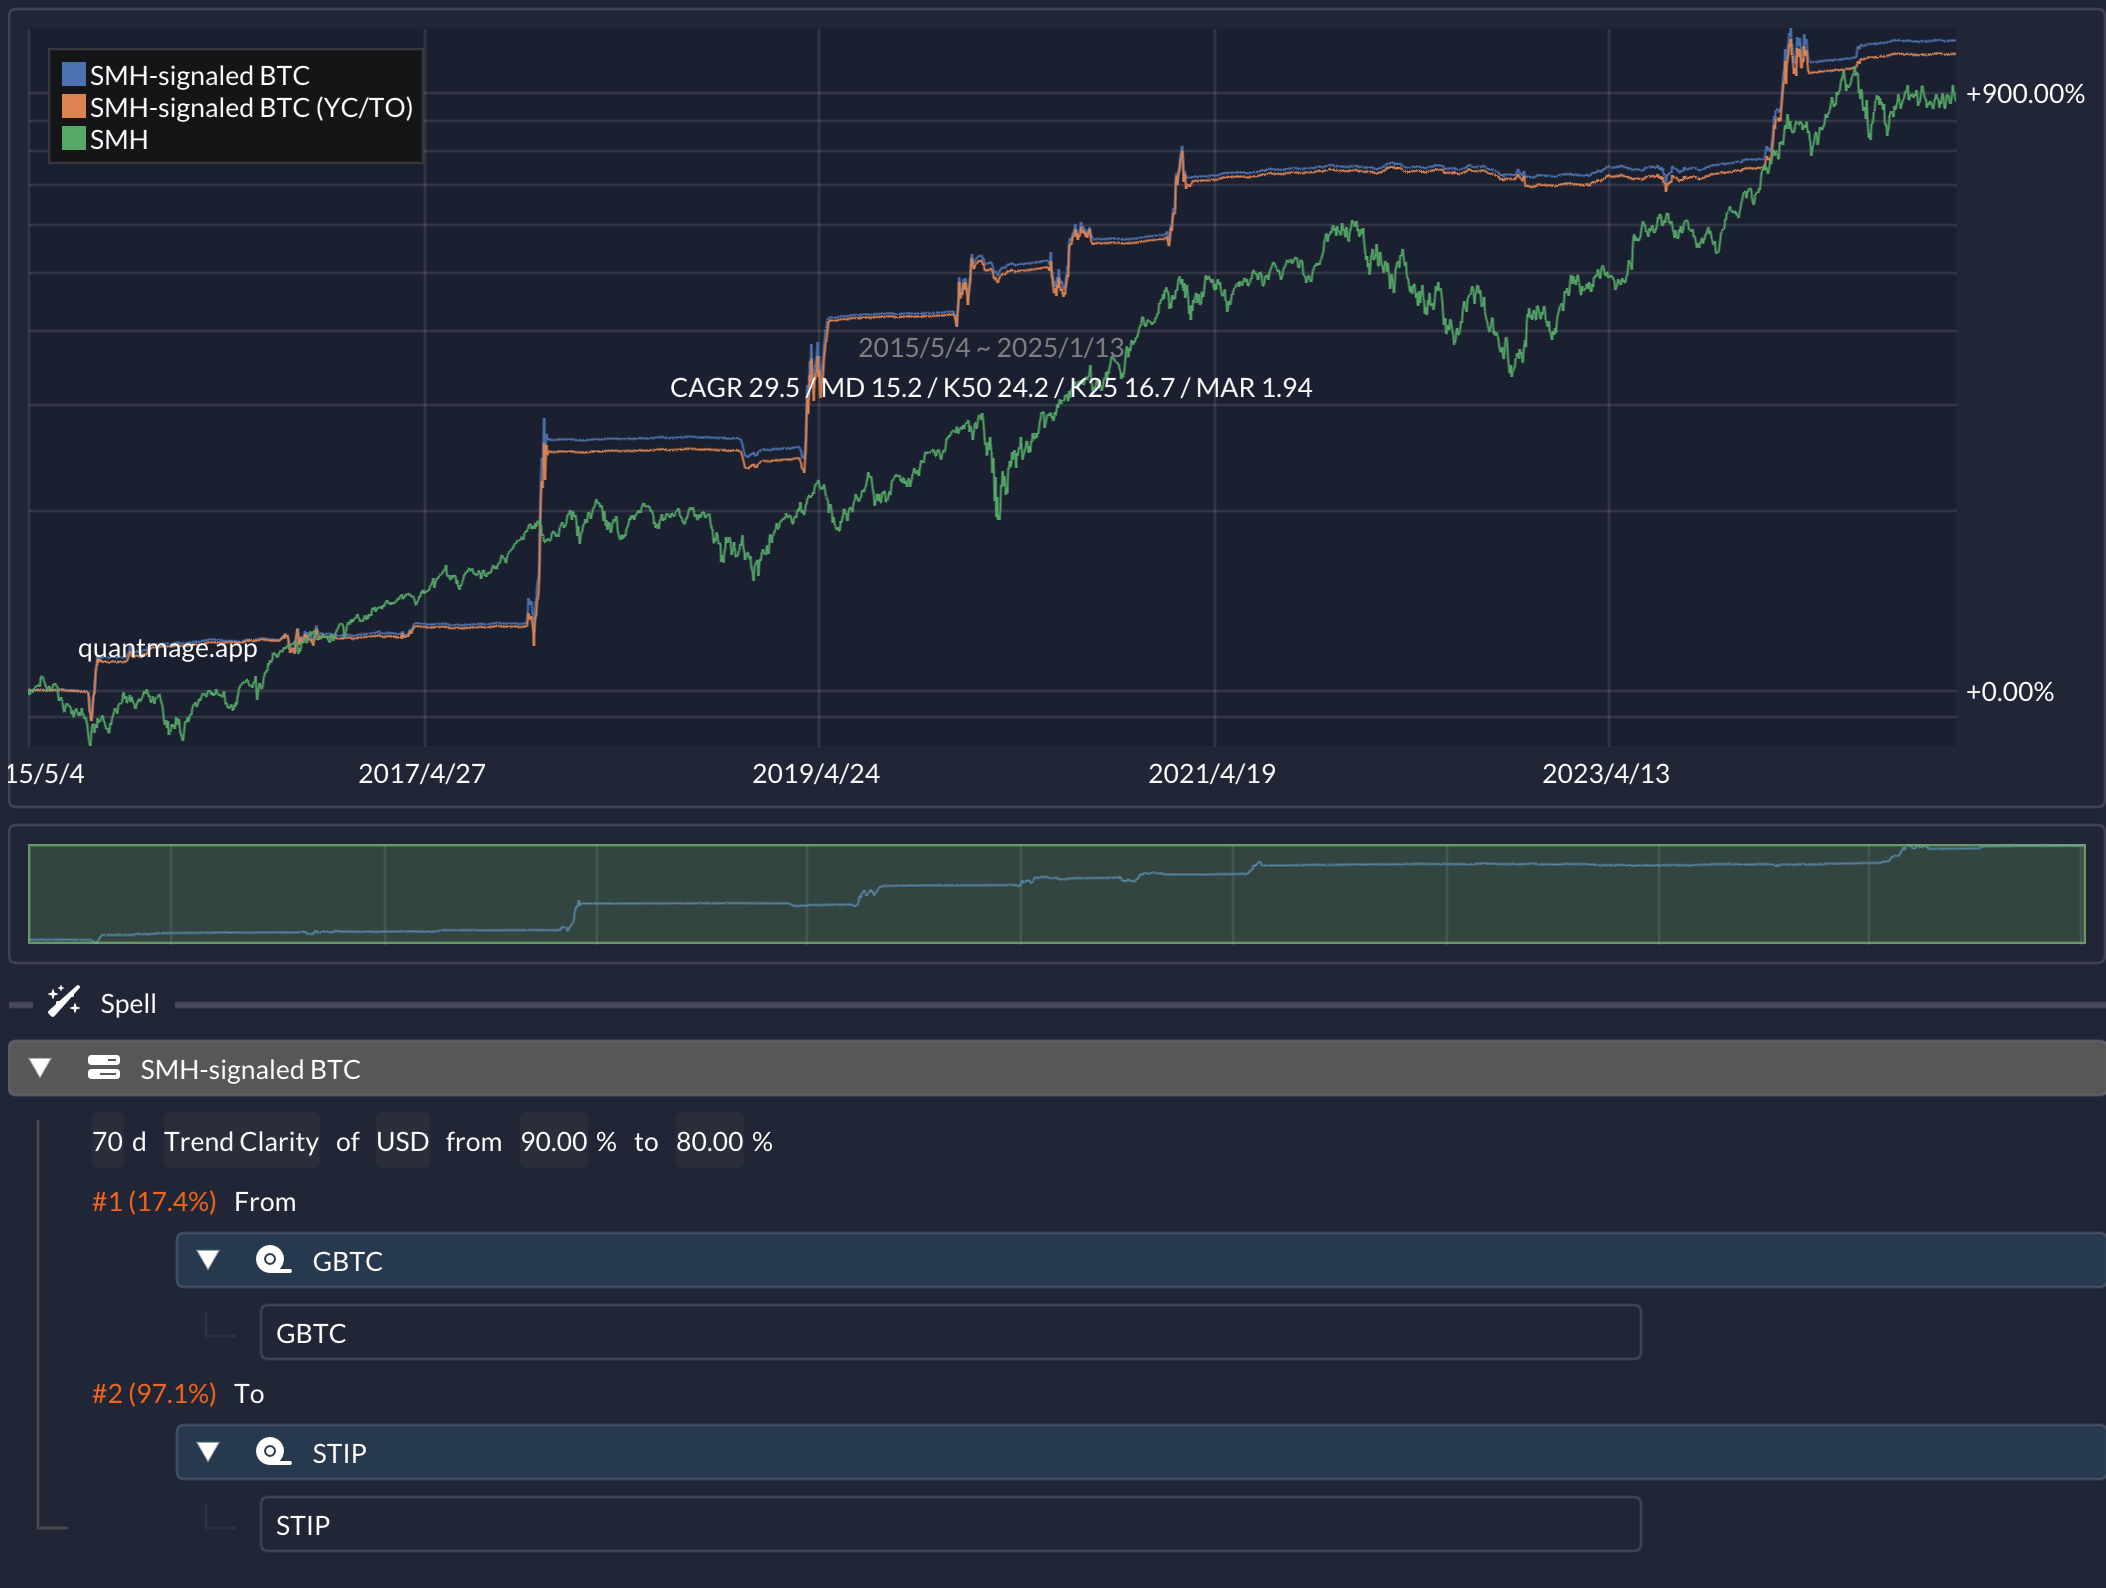
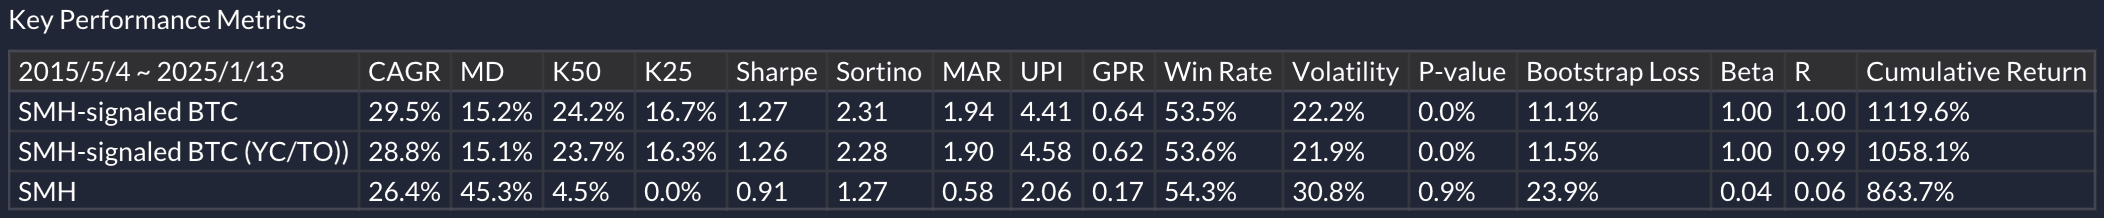
This strategy only hops into GBTC when the semiconductor ETF is trending very strongly. I used USD, a 2x leveraged ETF for semiconductors, but using a plain vanilla SMH works well, too. The results? An eye-catching annual return of 29.5% with a max drawdown of 15.2% over nine years, while being in GBTC just 17.4% of the time.
Why would a strong trend in semiconductors signal a rally in Bitcoin?
Semiconductors are widely viewed as a barometer for tech’s health and a “risk-on” indicator. They also tend to do well when global liquidity is high and interest rates are relatively low. Plus, while most Bitcoin mining now uses ASICs rather than GPUs, the broader mining ecosystem still needs advanced semiconductors. A surging semiconductor sector could hint at rising crypto-mining activity—often when crypto prices are on an upswing.
Caveats
But before we all quit our day jobs and let these strategies ride, remember these are very short backtesting windows. For the first strategy, the “risk-on” condition only triggered six times in its eight-year backtest. We’re also dealing with assets that haven’t been around (in mainstream adoption) for very long. That doesn’t mean these ideas are bunk—it’s just a reminder to temper expectations when dealing with limited data and an evolving market.
What do you think? Are these strategies too good to be true, or does Bitcoin really have some Nostradamus vibes going on? I’d love to hear your thoughts!
🚨 Disclaimer: Our incantations may be potent, but they aren’t foolproof. Markets change, and while we aim to give you our best analysis, always do your own research and consider professional advice. We’re here to inform, not dictate.
As lovely as all this looks, I might have to throw a wrench in the works. The normally close relationship between Bitcoin and the general stock market might be broken at the present time.
While normally, Bitcoin seems to be an indicator of the stockmarket's animal spirits, right now it might more so be an indicator of the hope that Trump is going to create a wonderful new Crypto world. So, the stock market could crash while Bitcoin stays high and mighty. Or Bitcoin might crash while SPY reaches new highs.
It's going to be exciting to see how this all plays out! And as they say, those who have a workable theory can more quickly understand what's going on in practice.
thanks for the mention!
The relationship between SMH and GBTC is quite remarkable. Very good catch.
Here's something with numbers that are even more intoxicated: CAGR since 2016 104.74%, max drawdown -67.33%. Not to be taken seriously, of course.
https://tinyurl.com/5n75zutb