
Adaptive Momentum
Tweaking Moving Averages for Market Conditions

I recently stumbled upon David Varadi’s blog, and let me tell you—it’s a treasure trove of fascinating systematic strategy ideas. What initially drew me in was an indicator he created called the Varadi Oscillator. But as I dug deeper, I became intrigued by his concept of Adaptive Momentum.
You see, when it comes to absolute momentum (also known as time series momentum), moving average crossovers are pretty standard. Whether you’re using a simple moving average or an exponential one, you have to pick a fixed look-back period. And that’s where things get tricky—there’s no perfect window that fits all market conditions.
Enter Adaptive Moving Averages (AMA). The key idea here is to vary the look-back period of an exponential moving average based on certain market variables. This allows the crossover to better navigate the market’s unpredictable whims.
Drawdown-Based AMA
In one of Varadi’s posts, he uses the percentile ranking of drawdowns as the market variable. The gist is that the adaptive moving average slows down as the market hits new highs and speeds up after significant drawdowns. Unfortunately, since percentile ranking and adaptive moving averages aren’t available in QuantMage, I had to get a bit creative.
So, I emulated the concept using three discrete look-back periods corresponding to different drawdown ranges:
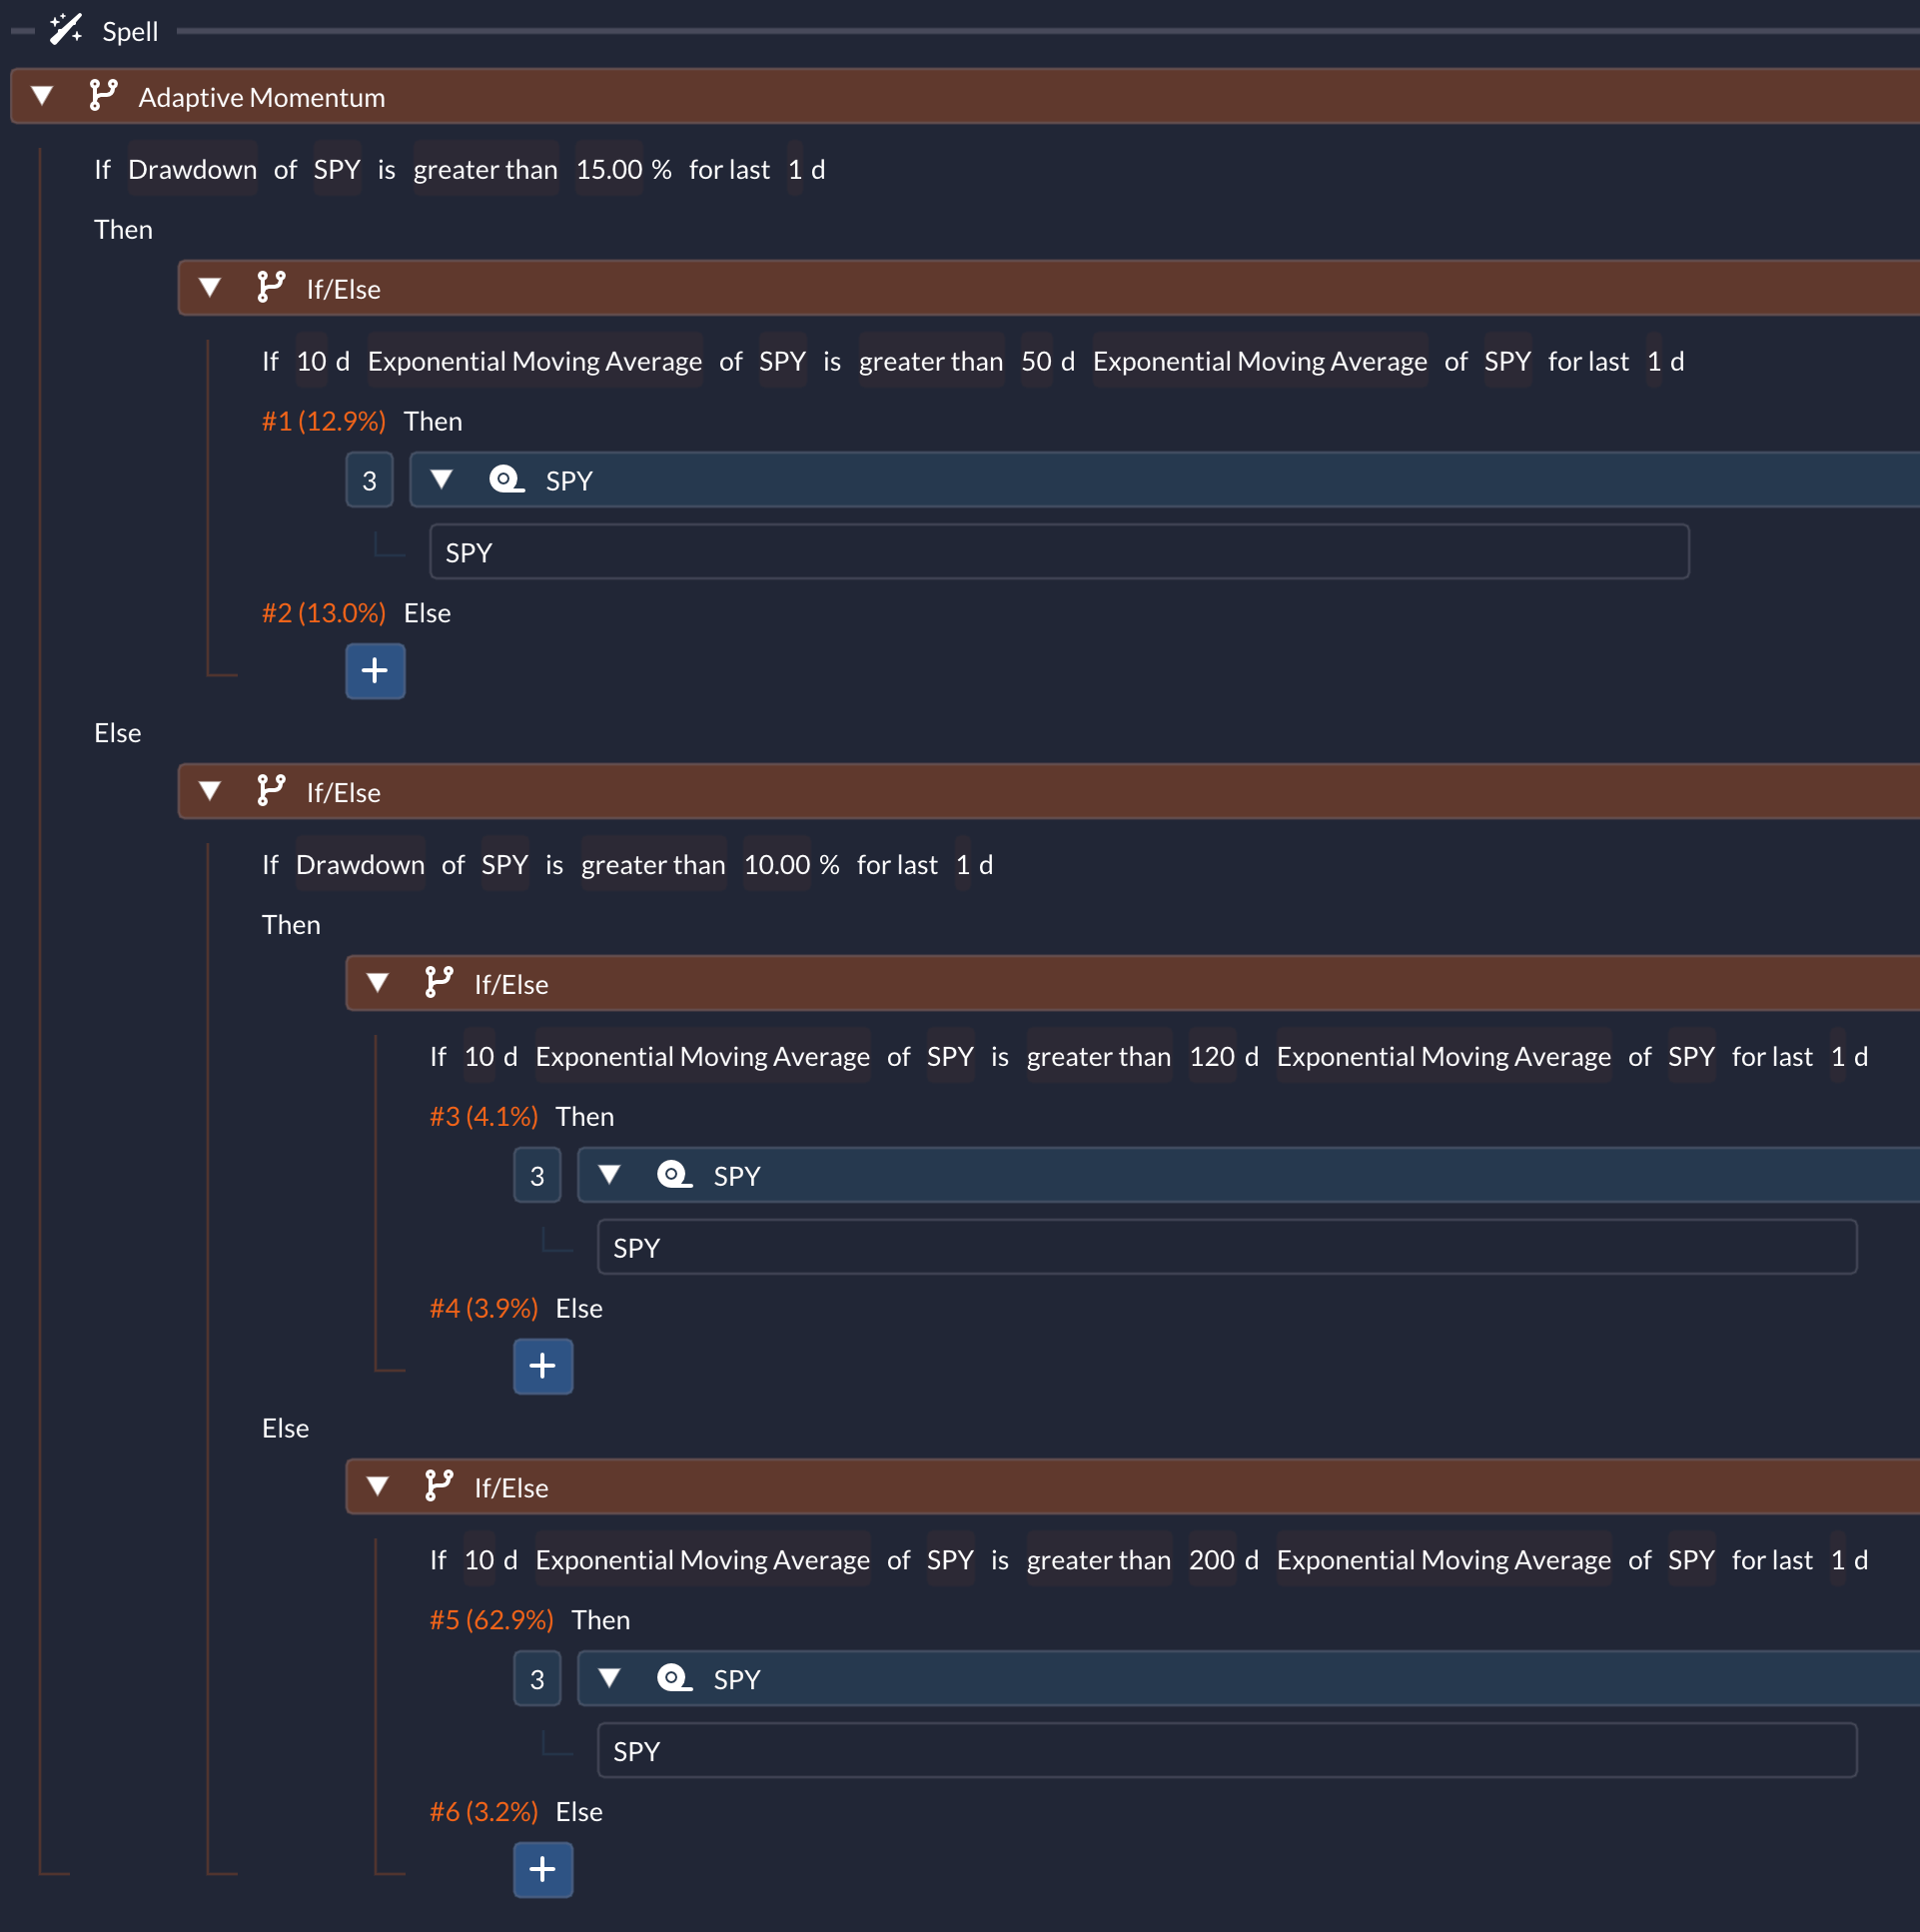
Here’s how it works:
Above 15% Drawdown: Uses the shortest look-back period of 50 days.
Below 10% Drawdown: Switches to the longest look-back period of 200 days.
Between 10% and 15% Drawdown: Settles on a medium look-back period of 120 days.
The idea is to be more nimble when drawdowns are high.
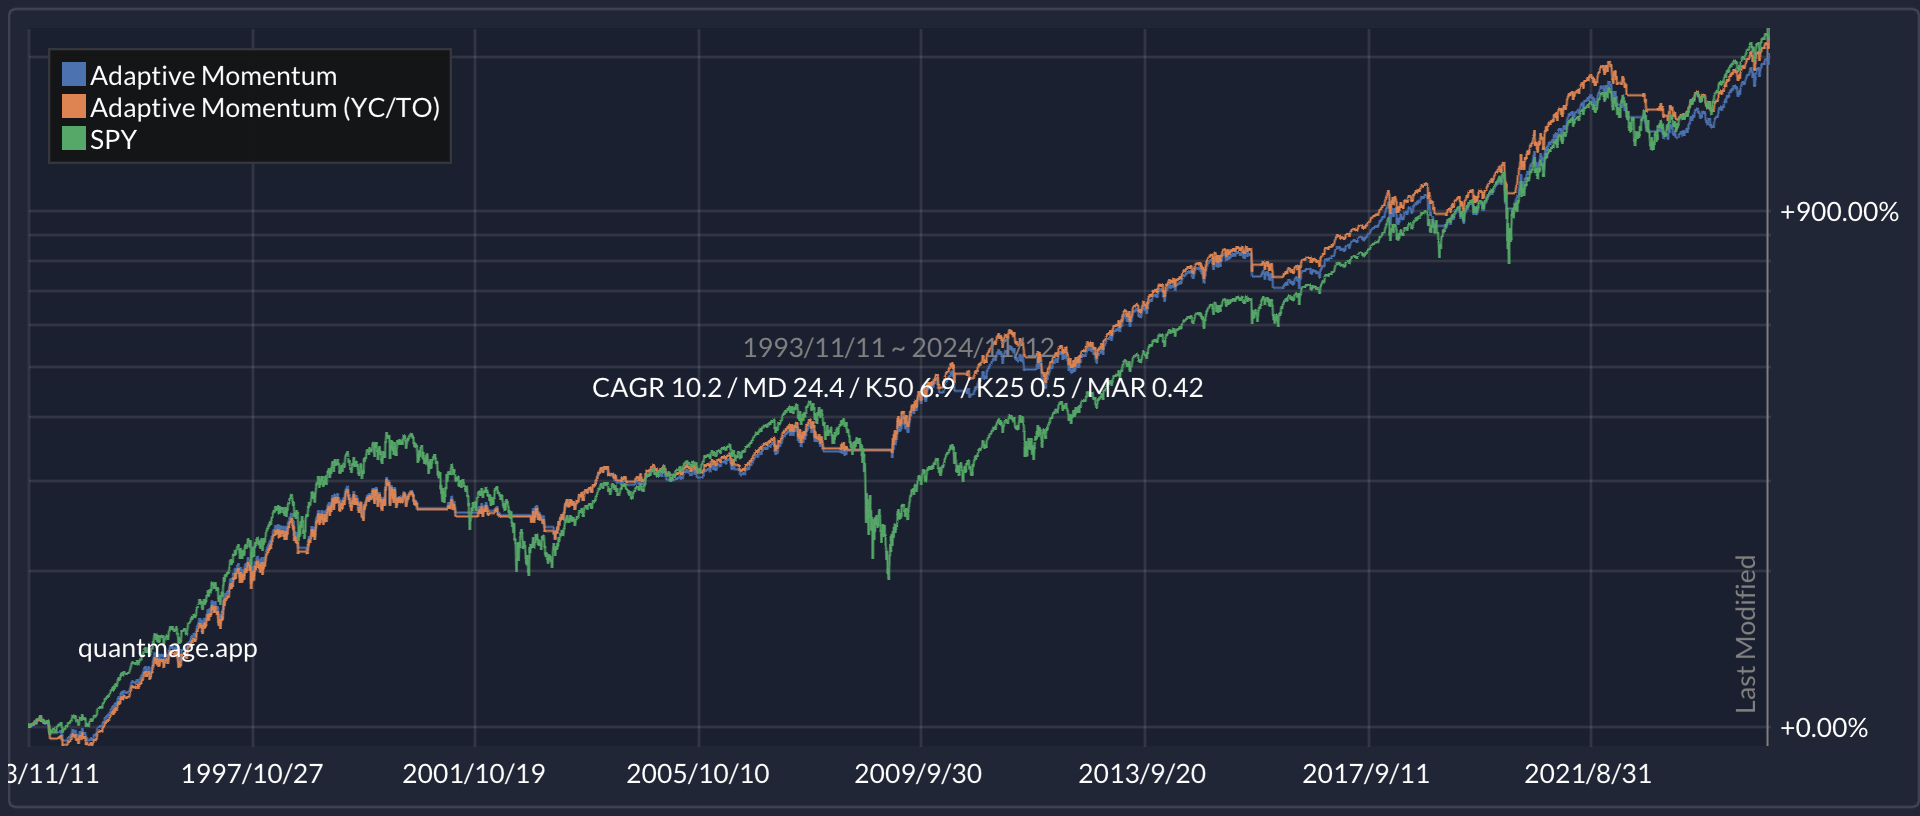
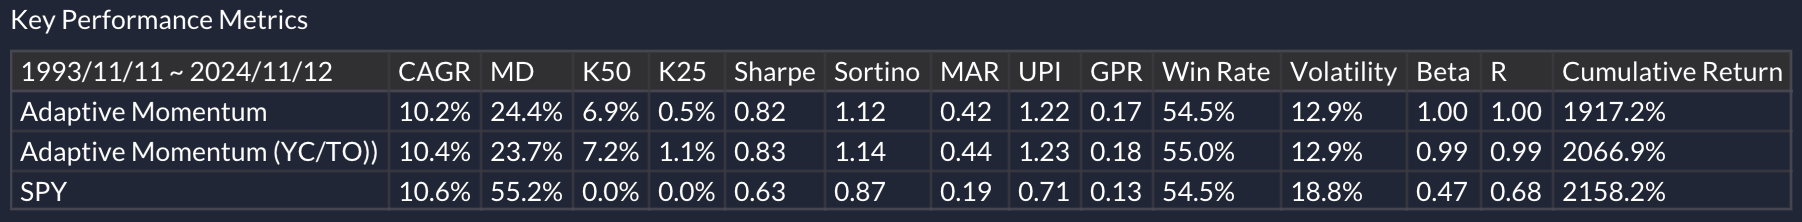
The results? Pretty solid! Over a 30-year period, this strategy achieved a Compound Annual Growth Rate (CAGR) of 10.2% with a maximum drawdown (MD) of 24.4%, all while being in the market only 80% of the time. That’s on par with a buy-and-hold strategy of the SPY but with significantly lower drawdowns and volatility. You can give the strategy a whirl here.
VIX-Based AMA
In another post, Varadi explores a different angle using the percentile ranking of the inverse of the average VIX (Volatility Index). The key insight is: “If VIX is higher, we want to smooth more or have a longer look-back; if it’s lower, we want a shorter look-back.”
At first, this seemed counterintuitive to me. I usually associate higher VIX with bigger drawdowns, so I thought it should be the other way around—like in the drawdown-based AMA.
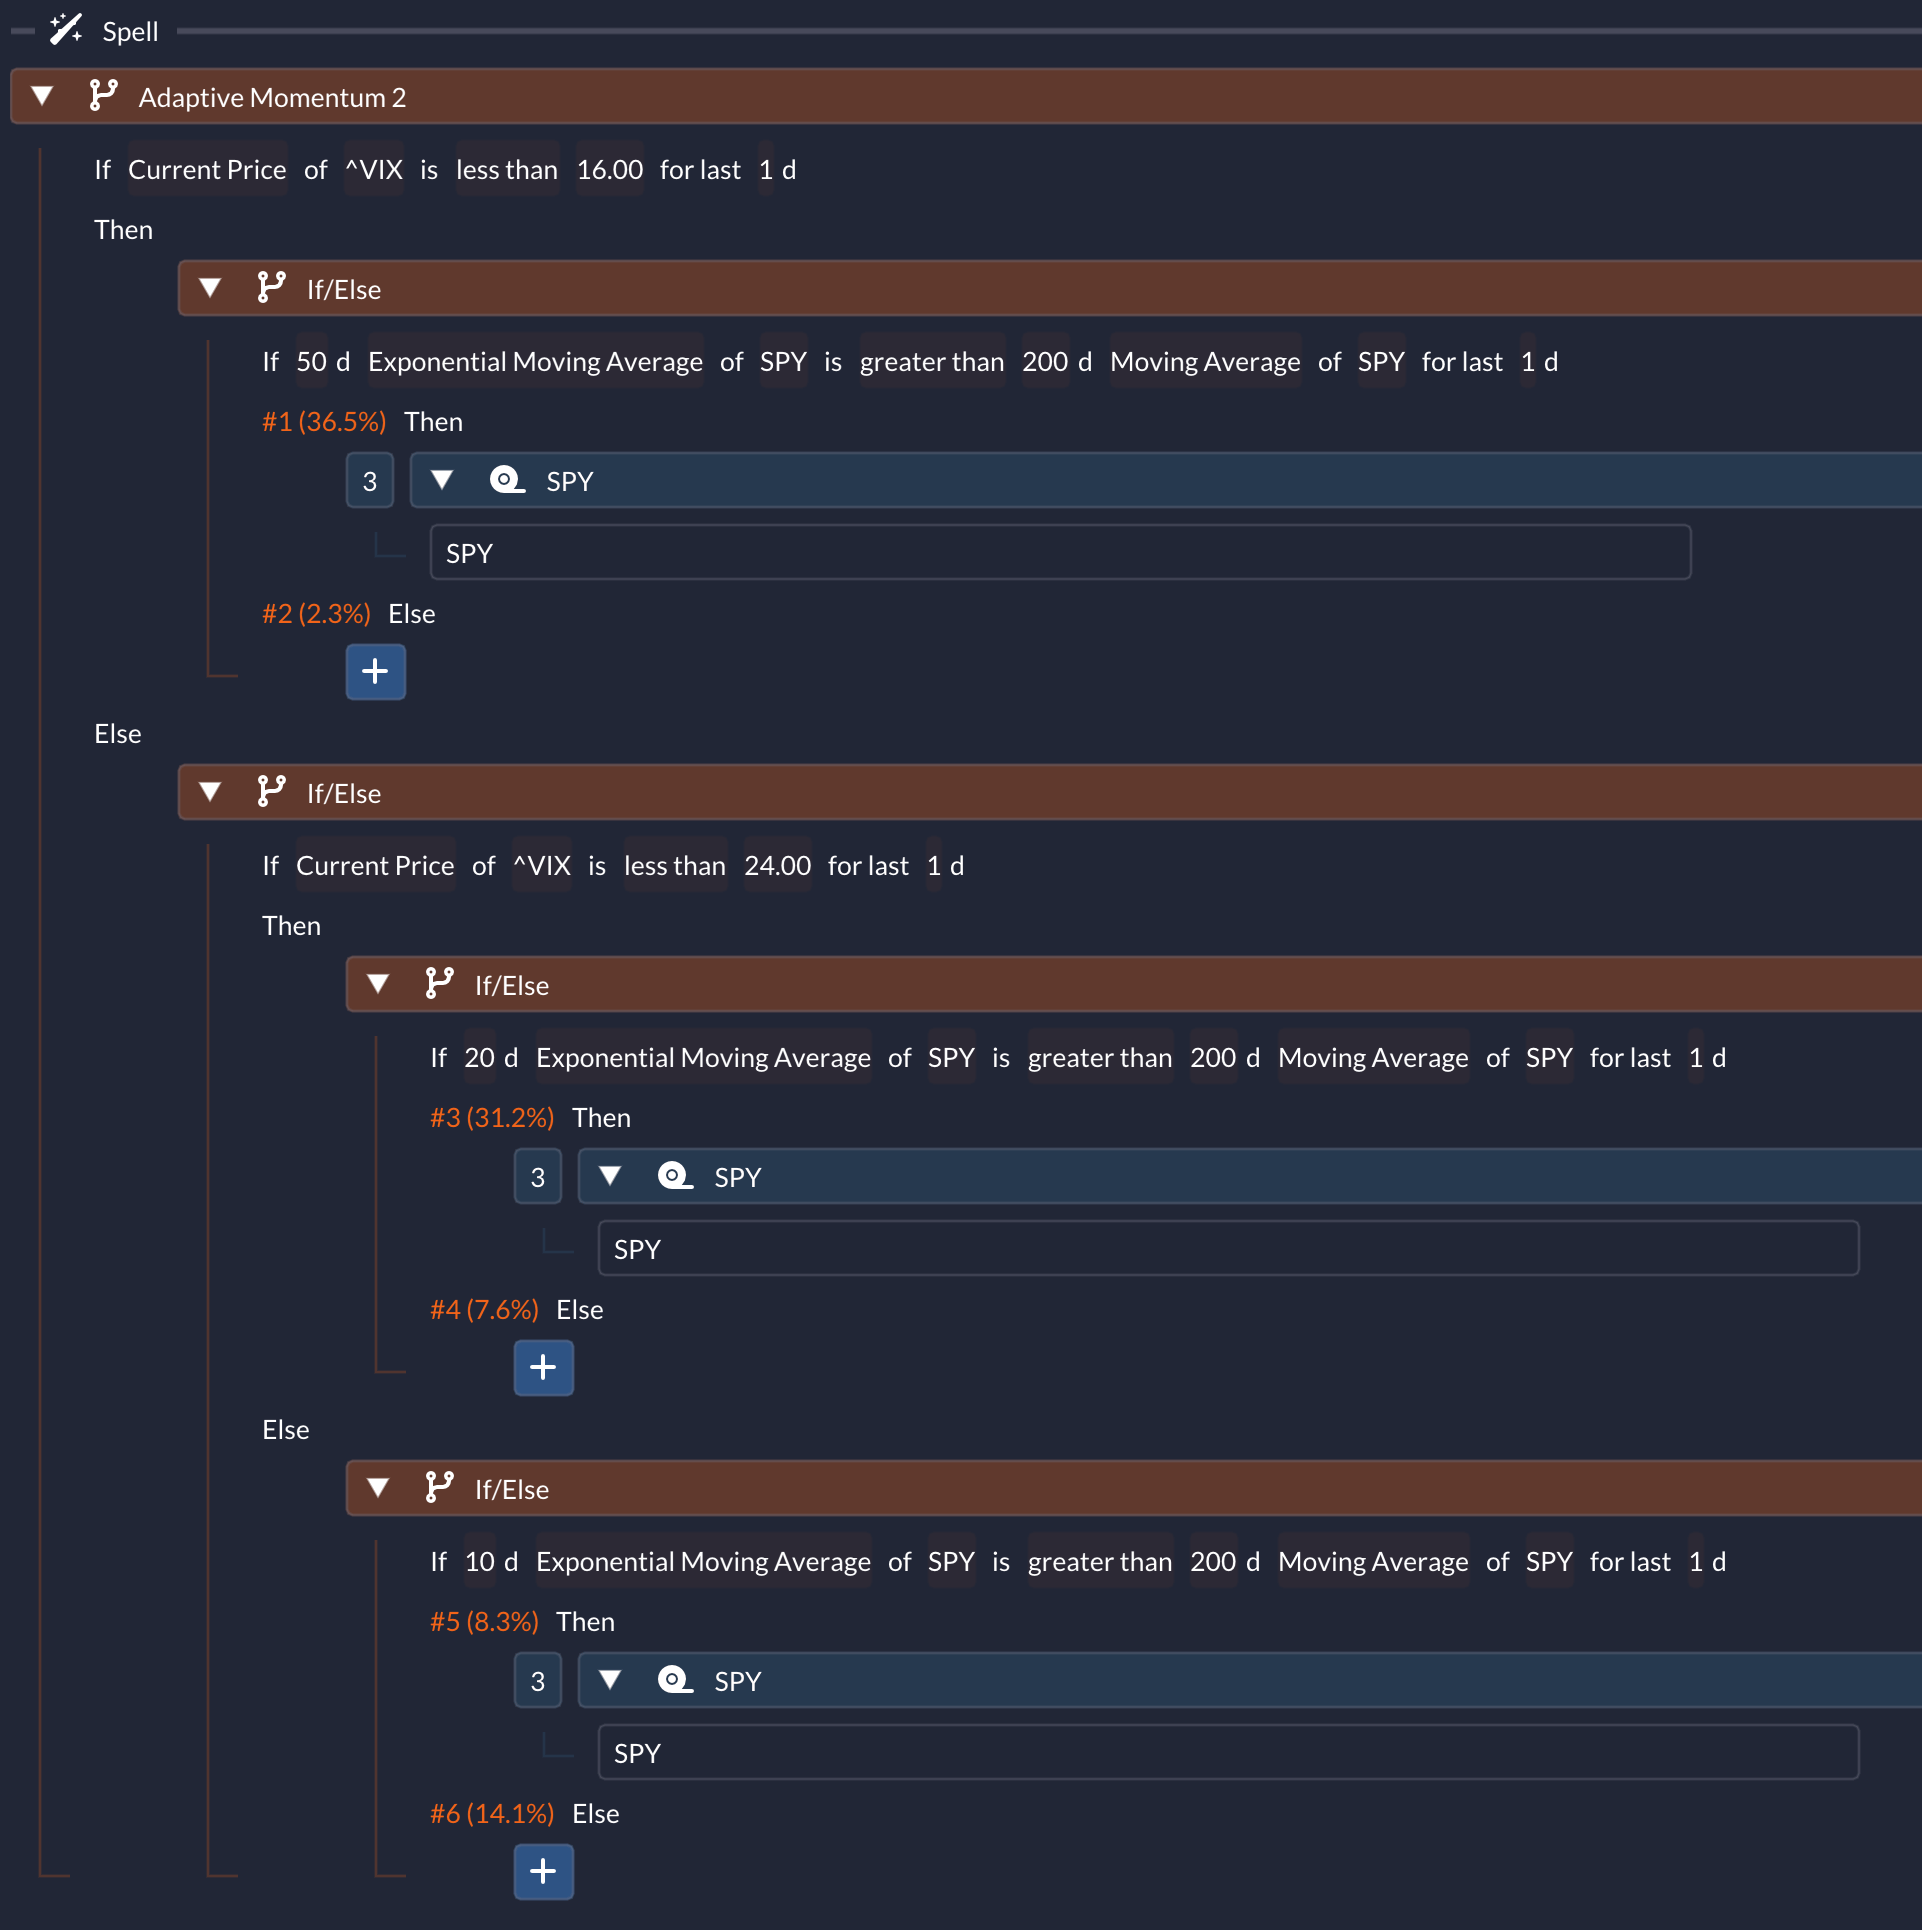
So, I flipped the script. I used a shorter period when VIX was higher, and this adjustment actually led to better performance. In this setup, I varied the EMA period from 10 days to 50 days and compared this adaptive moving average against a 200-day moving average.
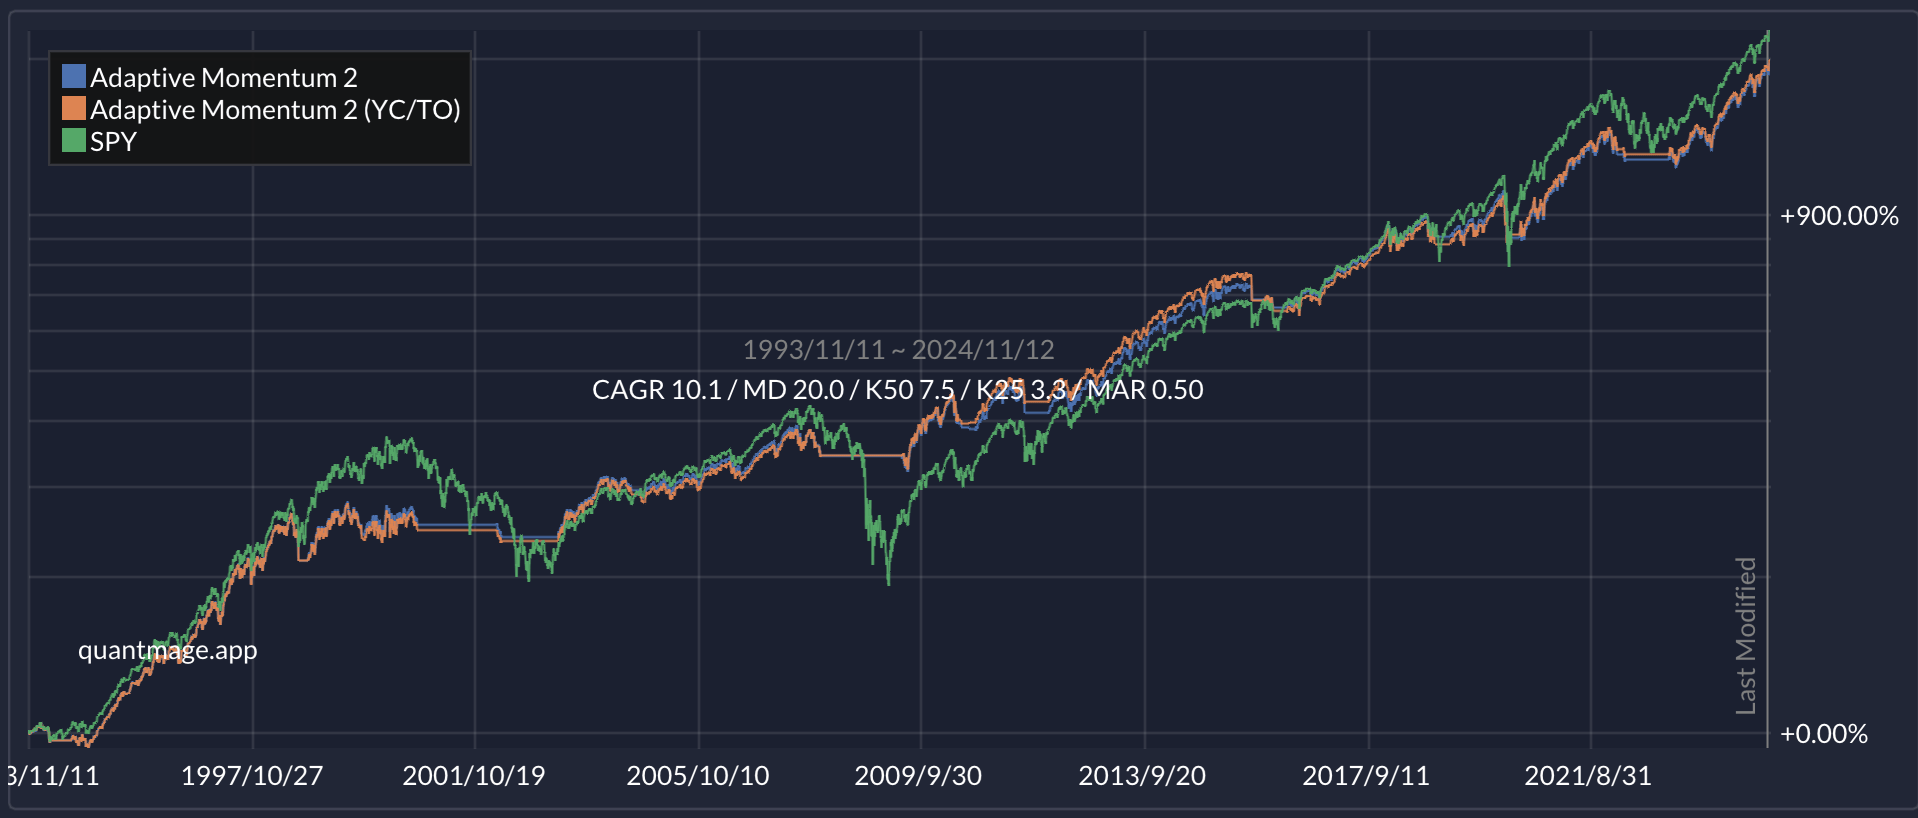
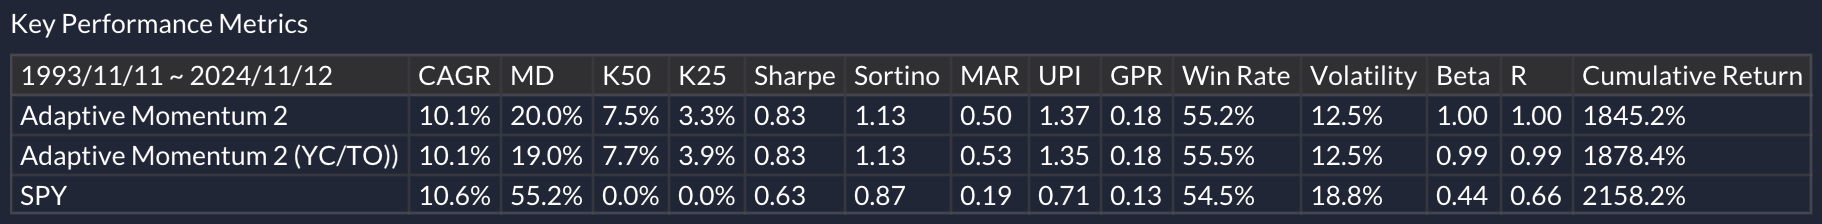
The outcome was comparable to the drawdown-based approach:
CAGR: 10.1%
Maximum Drawdown: 20.0%
Market Exposure: 76% over the same 30-year period
Now, there are some key differences from Varadi’s original method. My approach is a simplified emulation and doesn’t continuously adapt like a true AMA would. Plus, Varadi’s range was from 2 to 26 days, which is shorter than the range I used. Feel free to explore this strategy further here.
Takeaway
So, what are your thoughts? Do these adaptive strategies resonate with you? For me, the main takeaway is embracing the concept of adaptive moving averages rather than fixating on specific market variables or the exact strategies I discussed. Who knows—if you dig deeper, you might uncover even more potent applications of this idea using variables you wouldn’t typically consider!
📣 Just a quick note: This content is for informational purposes only. It’s not investment advice or a recommendation to buy or sell any securities. Always do your own research and consider consulting a financial professional before making any investment decisions.
Great article! Thank you for sharing.